release
November Release: Period-on-Period Cost Variance Analysis
November release adds month-on-month cost variance reports — slice spend by subscription, resource group, or service to find the drivers of every spike.
Month on Month Cost Analysis by Type
The CloudMonitor November release brings 2 great new reports to help customers find resources that are contributing to recent cost increases:
This functionality is incredibly powerful as we have the ability to slice and dice the costs over time by types such as Subscription, Resource Group or even by Created By person.
This functionality is incredibly powerful as we have the ability to slice and dice the costs over time by types such as Subscription, Resource Group or even by Created By person.
It’s easiest to start looking for cost changes in your Cost Group, and then zoom in on the Subscription and Resource Groups that have the biggest change. The “Top 20 Resources By Cost Change” will show you the Azure resources with the biggest cost variance in the period so you can quickly identify contributing causes and follow up with the Creator or Owner of the resource causing the issue.

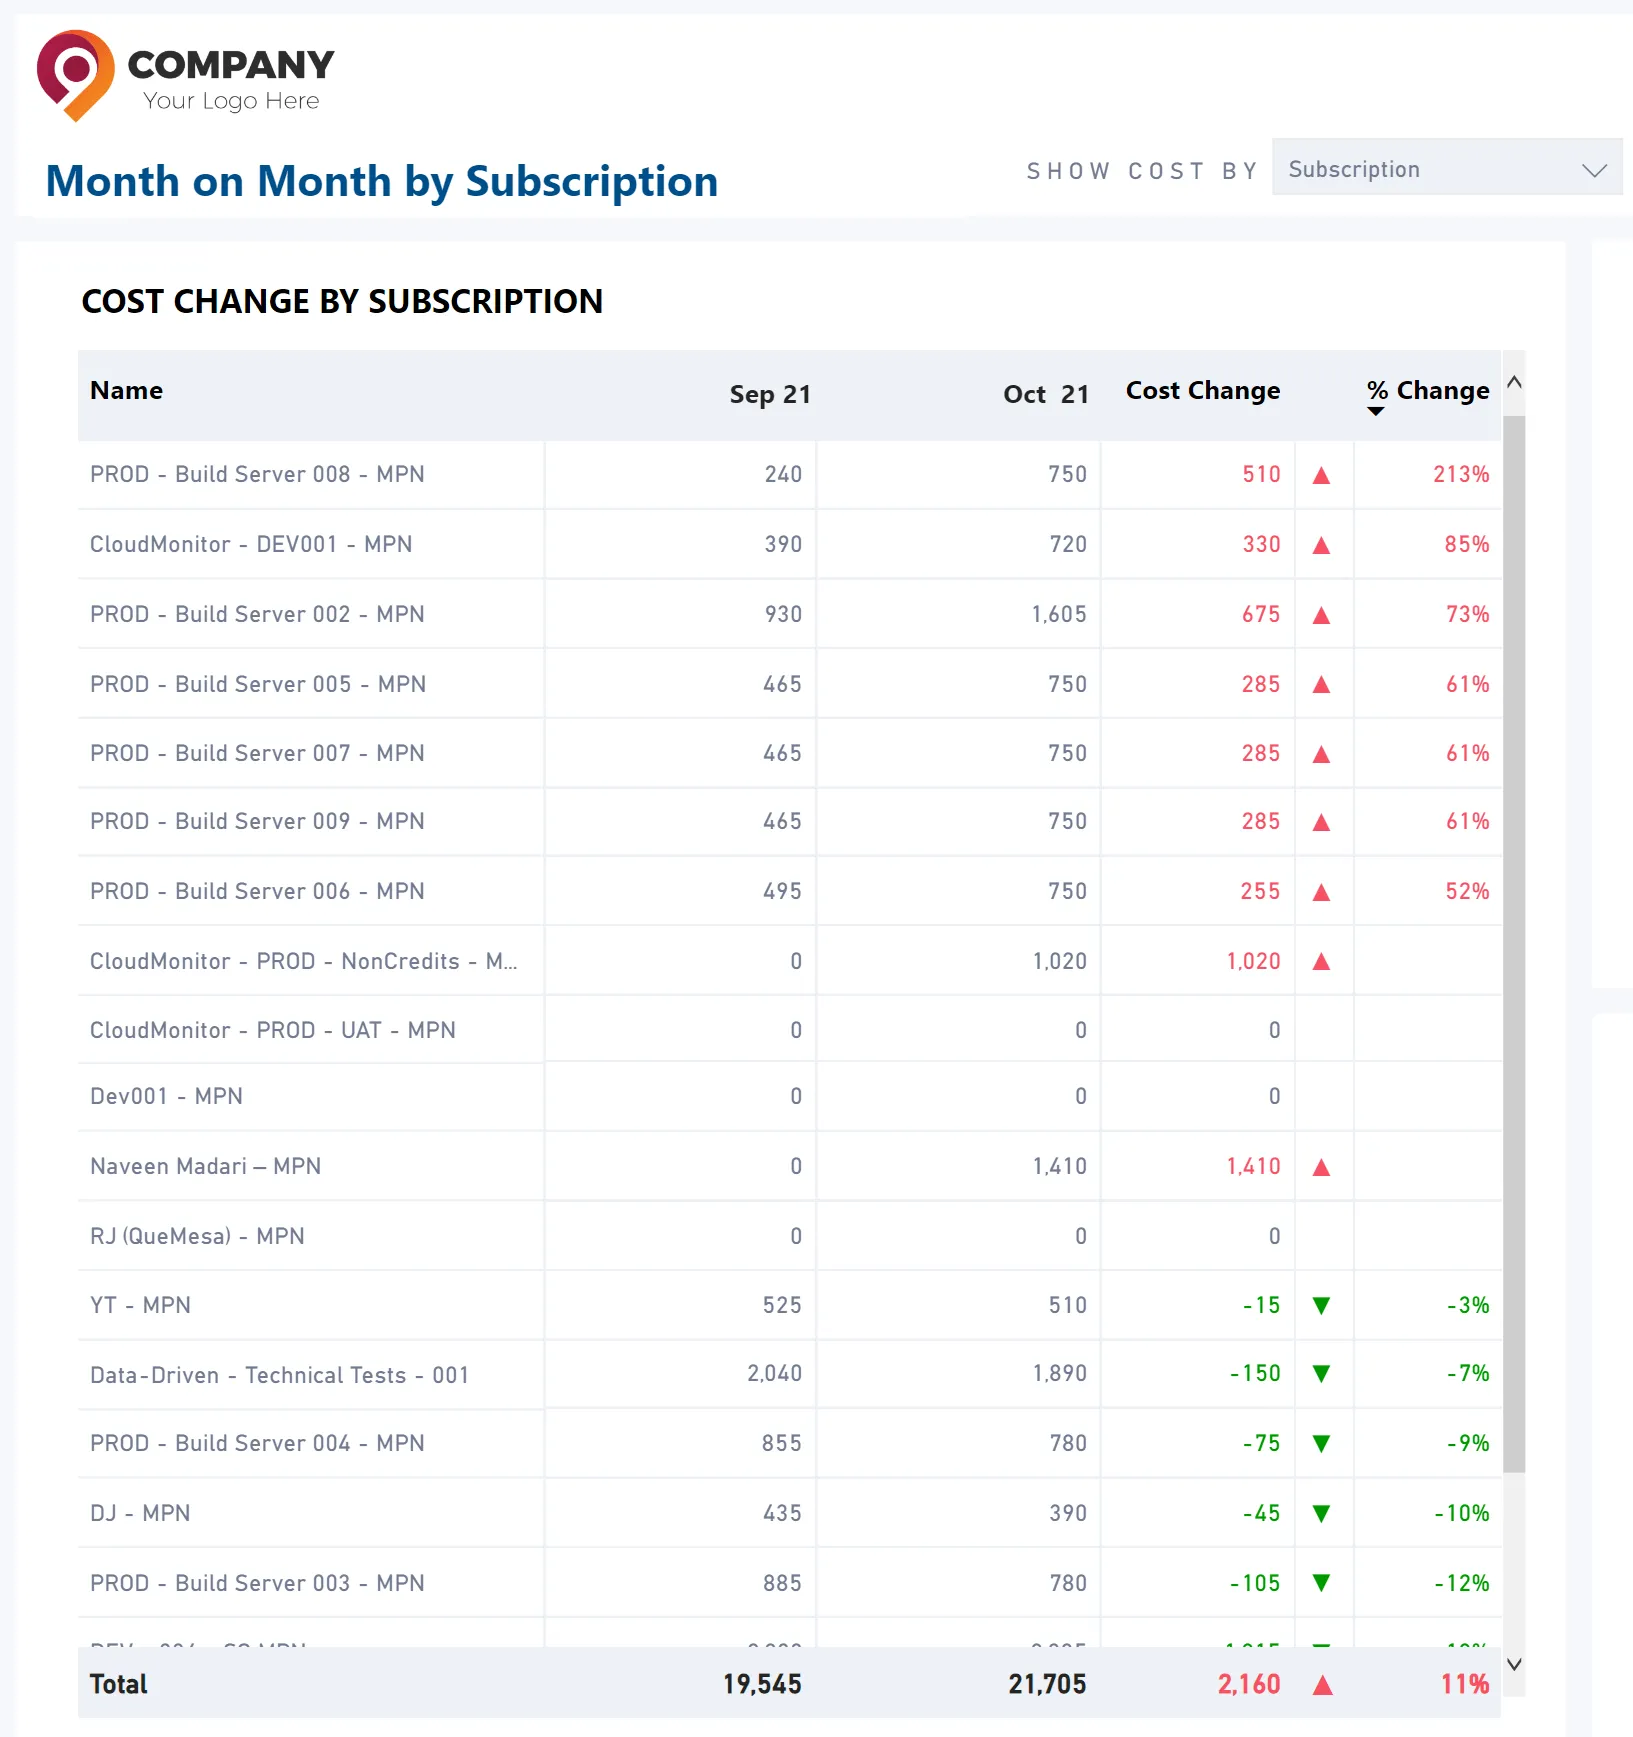
For example, here we choose a Cost Group, select “Show Costs by Subscription” and see a list of all the Subscriptions in our Cost Group with a Month on Month variance cost change (or % change).
We can see below that our PROD Build Server 008 Subscription had a huge increase of 213% ($510) in the last month!
Let’s zoom into that Subscription to find out what happened!

Immediately, we can see that a single Virtual Machine, created on the 15th of September by Nheil Mercado, caused the cost increase.
We also know that the CloudMonitor Teams Bot would have sent Nheil an alert for this cost anomaly – so there might have been a good reason for it. Still, we’ll confirm with Nheil if it was a legitimate change.
One of the key differentiators in CloudMonitor is that all resources have a Created By Date and a Created By person. This information is not available in the Azure portal, however, it is critical for good governance to know WHEN and WHO so that you can find out WHY.


As with most of the report pages, we can right-click on any Resource or User and drill through to the Resource Detail page to see more details about the Resource, Resource Group, Subscription, User, Cost Group etc.
Drilling into this Virtual Machine detail page and switching to the Costs tab, we can see indeed that this was spun up in October and it’s the B2ms Compute of the VM that is causing the cost. We can also check the Average Cost per Day to see if this is trending up or down for the resource.

We’ll demonstrate another example by answering a question our CFO might ask: “How much is the new datalake costing us since last year?”.
We set our CostGroup to this business unit and “Show Costs by” to “Consumed Service”. We can see below that we are paying more for Azure Synapse but less for SQL. We can now drill into our datalake to find out more if required.

It’s much easier to understand the power of the new features when looking at your own Azure estate.
Everything above is part of the standard CloudMonitor reports — watch the live demo to see how it helps lower your costs.
Try our live demo to discover how CloudMonitor, can help your organization in saving money on cloud cost spending.
- View Product Roadmap
- Request a Feature
- See all Release Notes