What CloudMonitor supplies.
Use billed Azure AI cost and live GitHub Copilot usage to see where spend goes and what to review. A lower unit cost shows efficiency; it is not proof of business return.
FinOps scope · AI
CloudMonitor puts billed AI product cost beside live GitHub Copilot usage and keeps the source attached. OpenAI, Anthropic, and Cursor token telemetry remains clearly labeled as not connected.
Inside the product
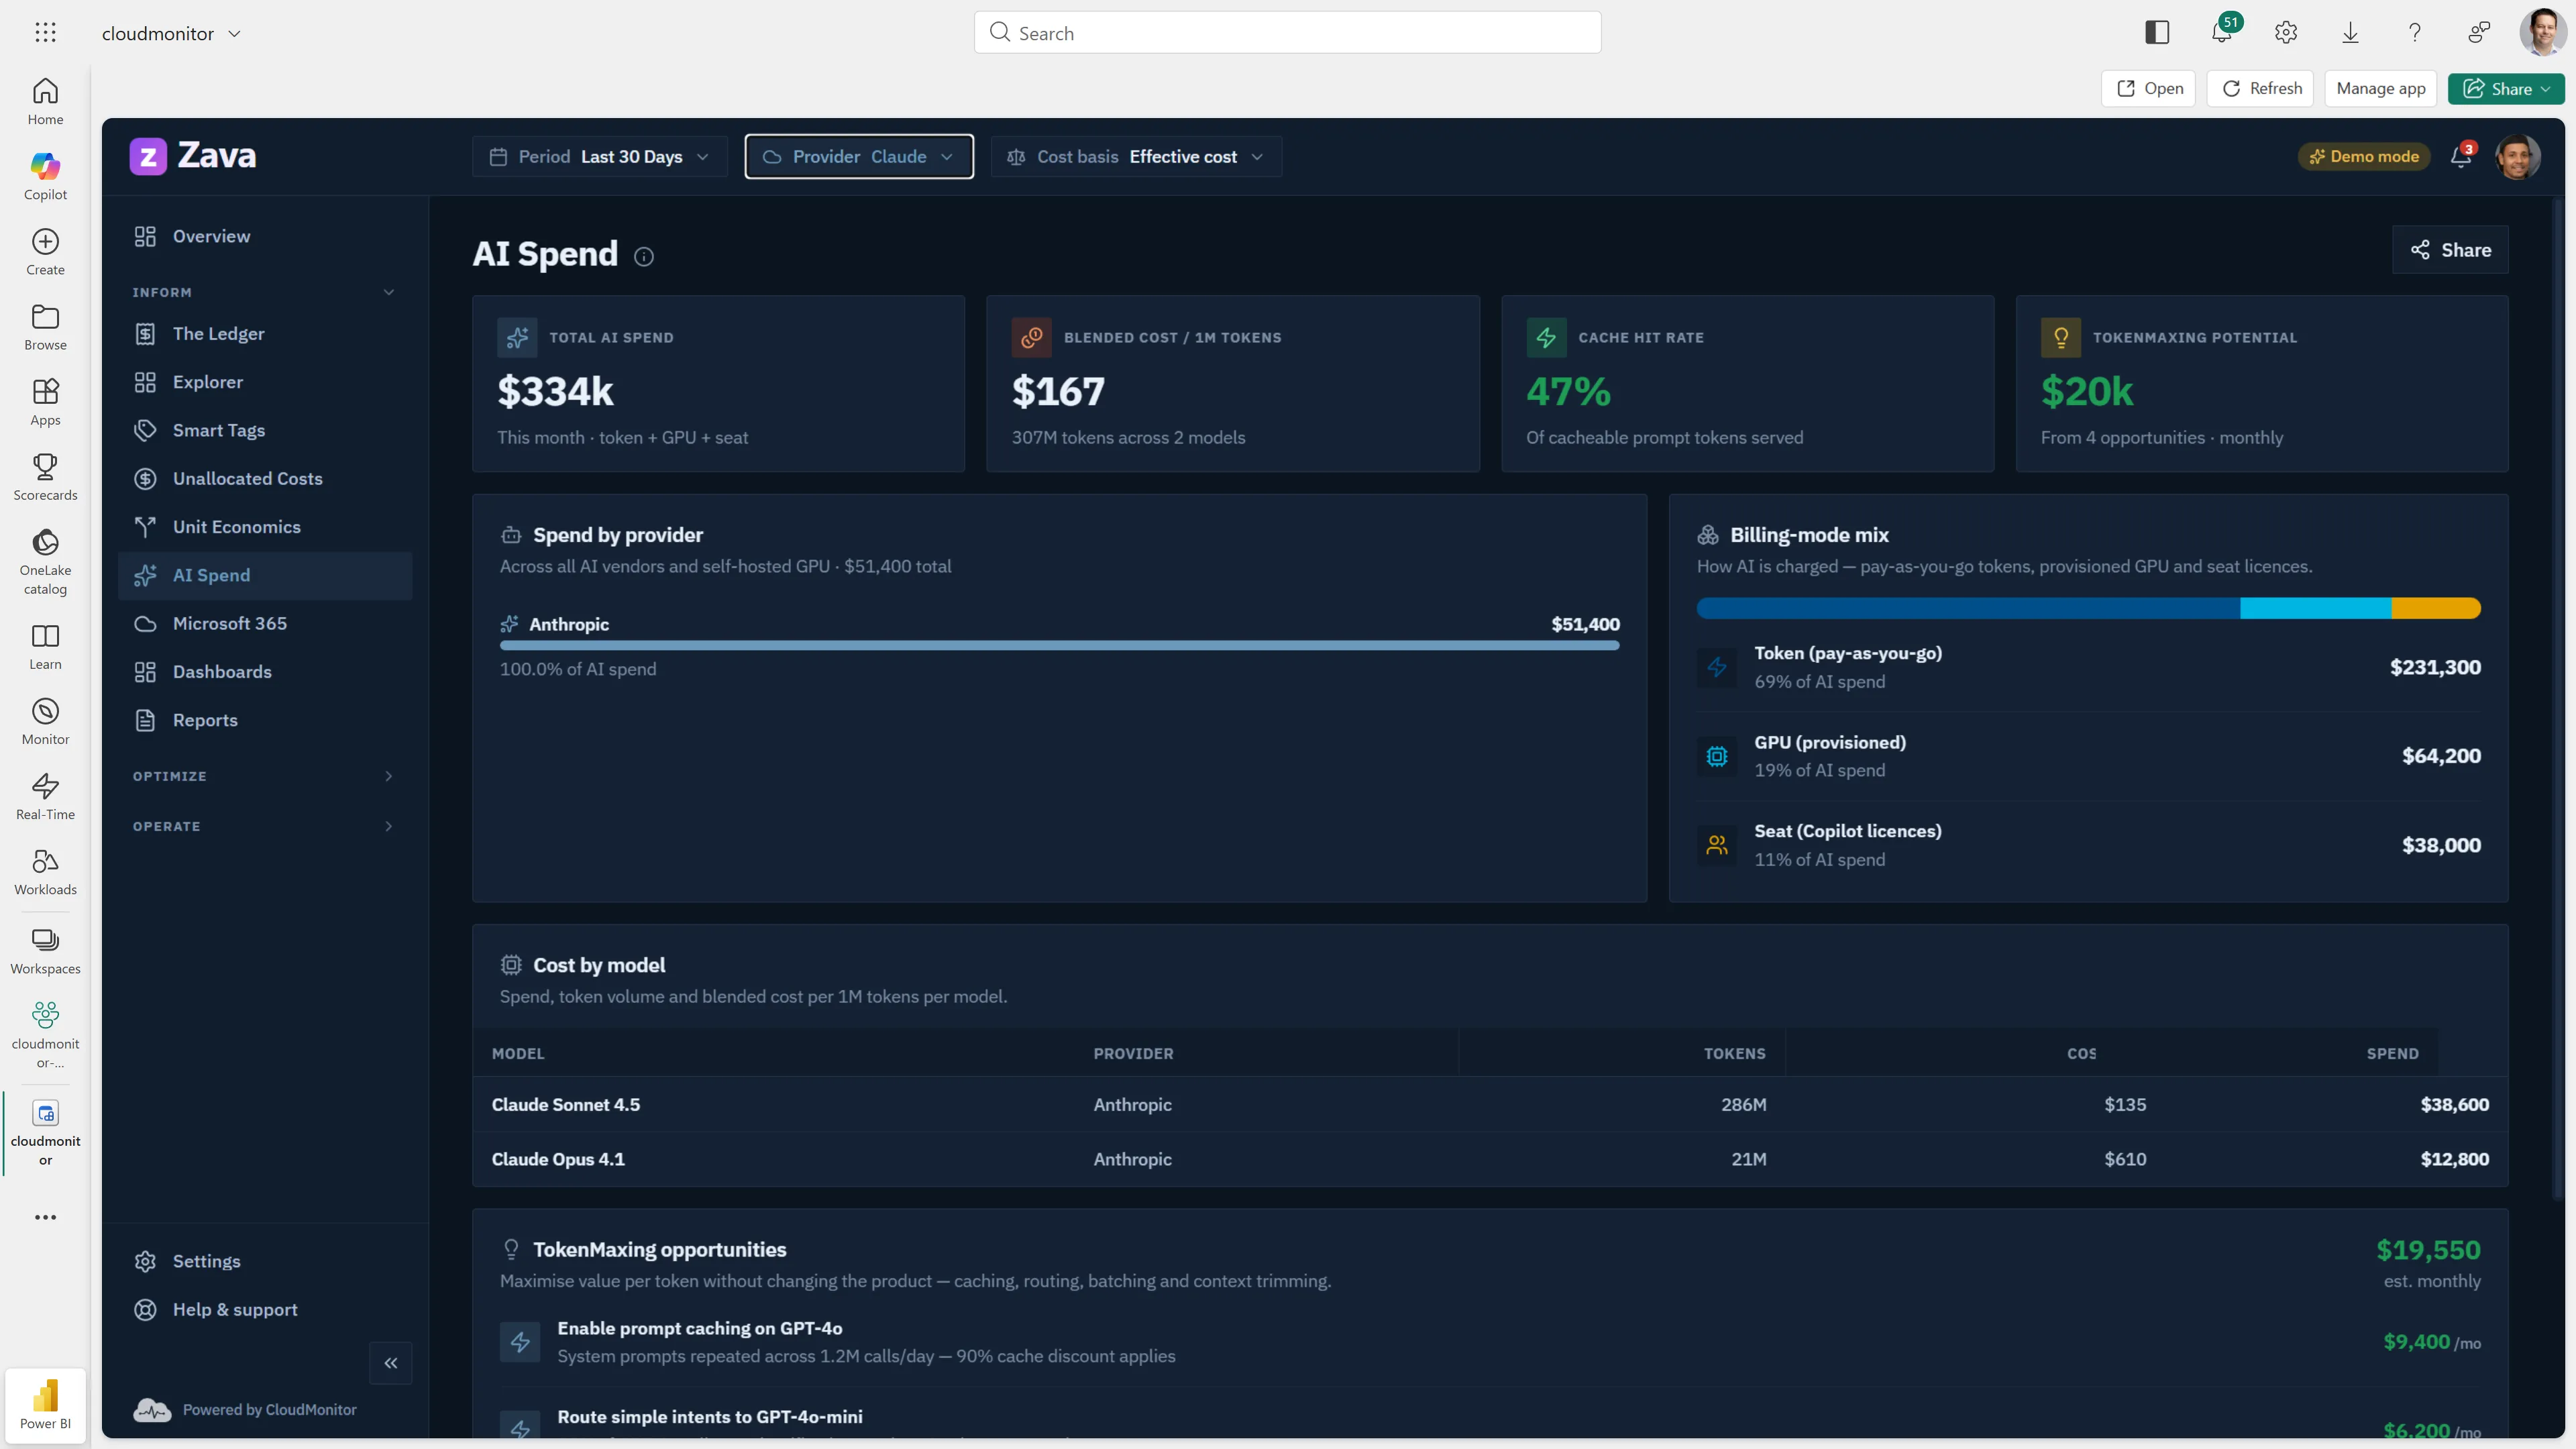
Explore the screen with sample data in the public demo. In a connected workspace, provider panels populate only when their usage feeds are available.
 Open interactive demo →
 Coverage before calculation
A cost-per-token metric is defensible only when the cost and the matching usage both come from connected sources. CloudMonitor starts with the charges it can verify, then shows which provider detail is available behind them.
| Source | What you can use today | Coverage |
|---|---|---|
| Azure OpenAI | Billed cost from Azure cost data, grouped with the rest of your cloud spend. | Live costNo token count inferred |
| Microsoft 365 Copilot | License cost when the Microsoft charge identifies the Copilot product. | Live costNo seat or token use inferred |
| GitHub Copilot | Usage, per-model detail, and the per-user feed after the GitHub connection syncs. | Live usageRequires the Copilot connection |
| OpenAI, Anthropic, Cursor | Token counts, cache-hit rates, and blended cost per million tokens are not live yet. | RoadmapProvider usage feeds not connected |
The app uses Token telemetry not connected when a provider feed is missing. Read the full explanation in AI Spend reports.
A defensible workflow
Start with billed cost from the connected cost source. Confirm the product and provider classification before explaining a movement.
Use Copilot usage where its feed is live. Do not calculate token efficiency from sample or unconnected provider detail.
For cost per ticket, order, or customer, supply the completed-month quantity your business already trusts. CloudMonitor performs the division.
See how Unit Economics keeps the rate honest →
From AI cost to business value
CloudMonitor establishes the connected technology-cost and usage baseline. Business outcomes live in ticketing, code, CRM, or product systems and must be attributed over the same period against a credible baseline.
Use billed Azure AI cost and live GitHub Copilot usage to see where spend goes and what to review. A lower unit cost shows efficiency; it is not proof of business return.
Add implementation, labor, governance, training, unconnected costs, and attributable outcomes from the systems your teams trust. Use Unit Economics to track cost per business measure alongside that evidence.
ROI = (attributable realized benefit − total AI investment cost) ÷ total AI investment cost. Use the same measurement period and count only benefit that the evidence links to the AI investment.
Getting connected
Your Azure administrator approves the CloudMonitor application and provisions the service principal with the required scoped roles. Total elapsed time depends mainly on how quickly your team can create and approve that access.
Once the billing connection validates, CloudMonitor starts the first refresh. GitHub Copilot can then be connected for live usage detail; missing provider feeds remain visibly unavailable.
Other FinOps scopes
Ask Finn
Ask Finn connects provider, model, application, and cost-group signals, then shows the forecast and rows behind the explanation.
For August, which provider, model, and application drove AI spend growth, and when will we cross budget?
Add the period, cost group, and selected cost basis.
Source: this page interprets the FinOps for AI technology category published by the FinOps Foundation, licensed under CC BY 4.0. The wording, examples, and product mapping on this page are CloudMonitor’s own.
Connect Azure billing first; add live usage where available, then build an evidence base for unit economics and ROI.