Manually refresh a stale Power BI report
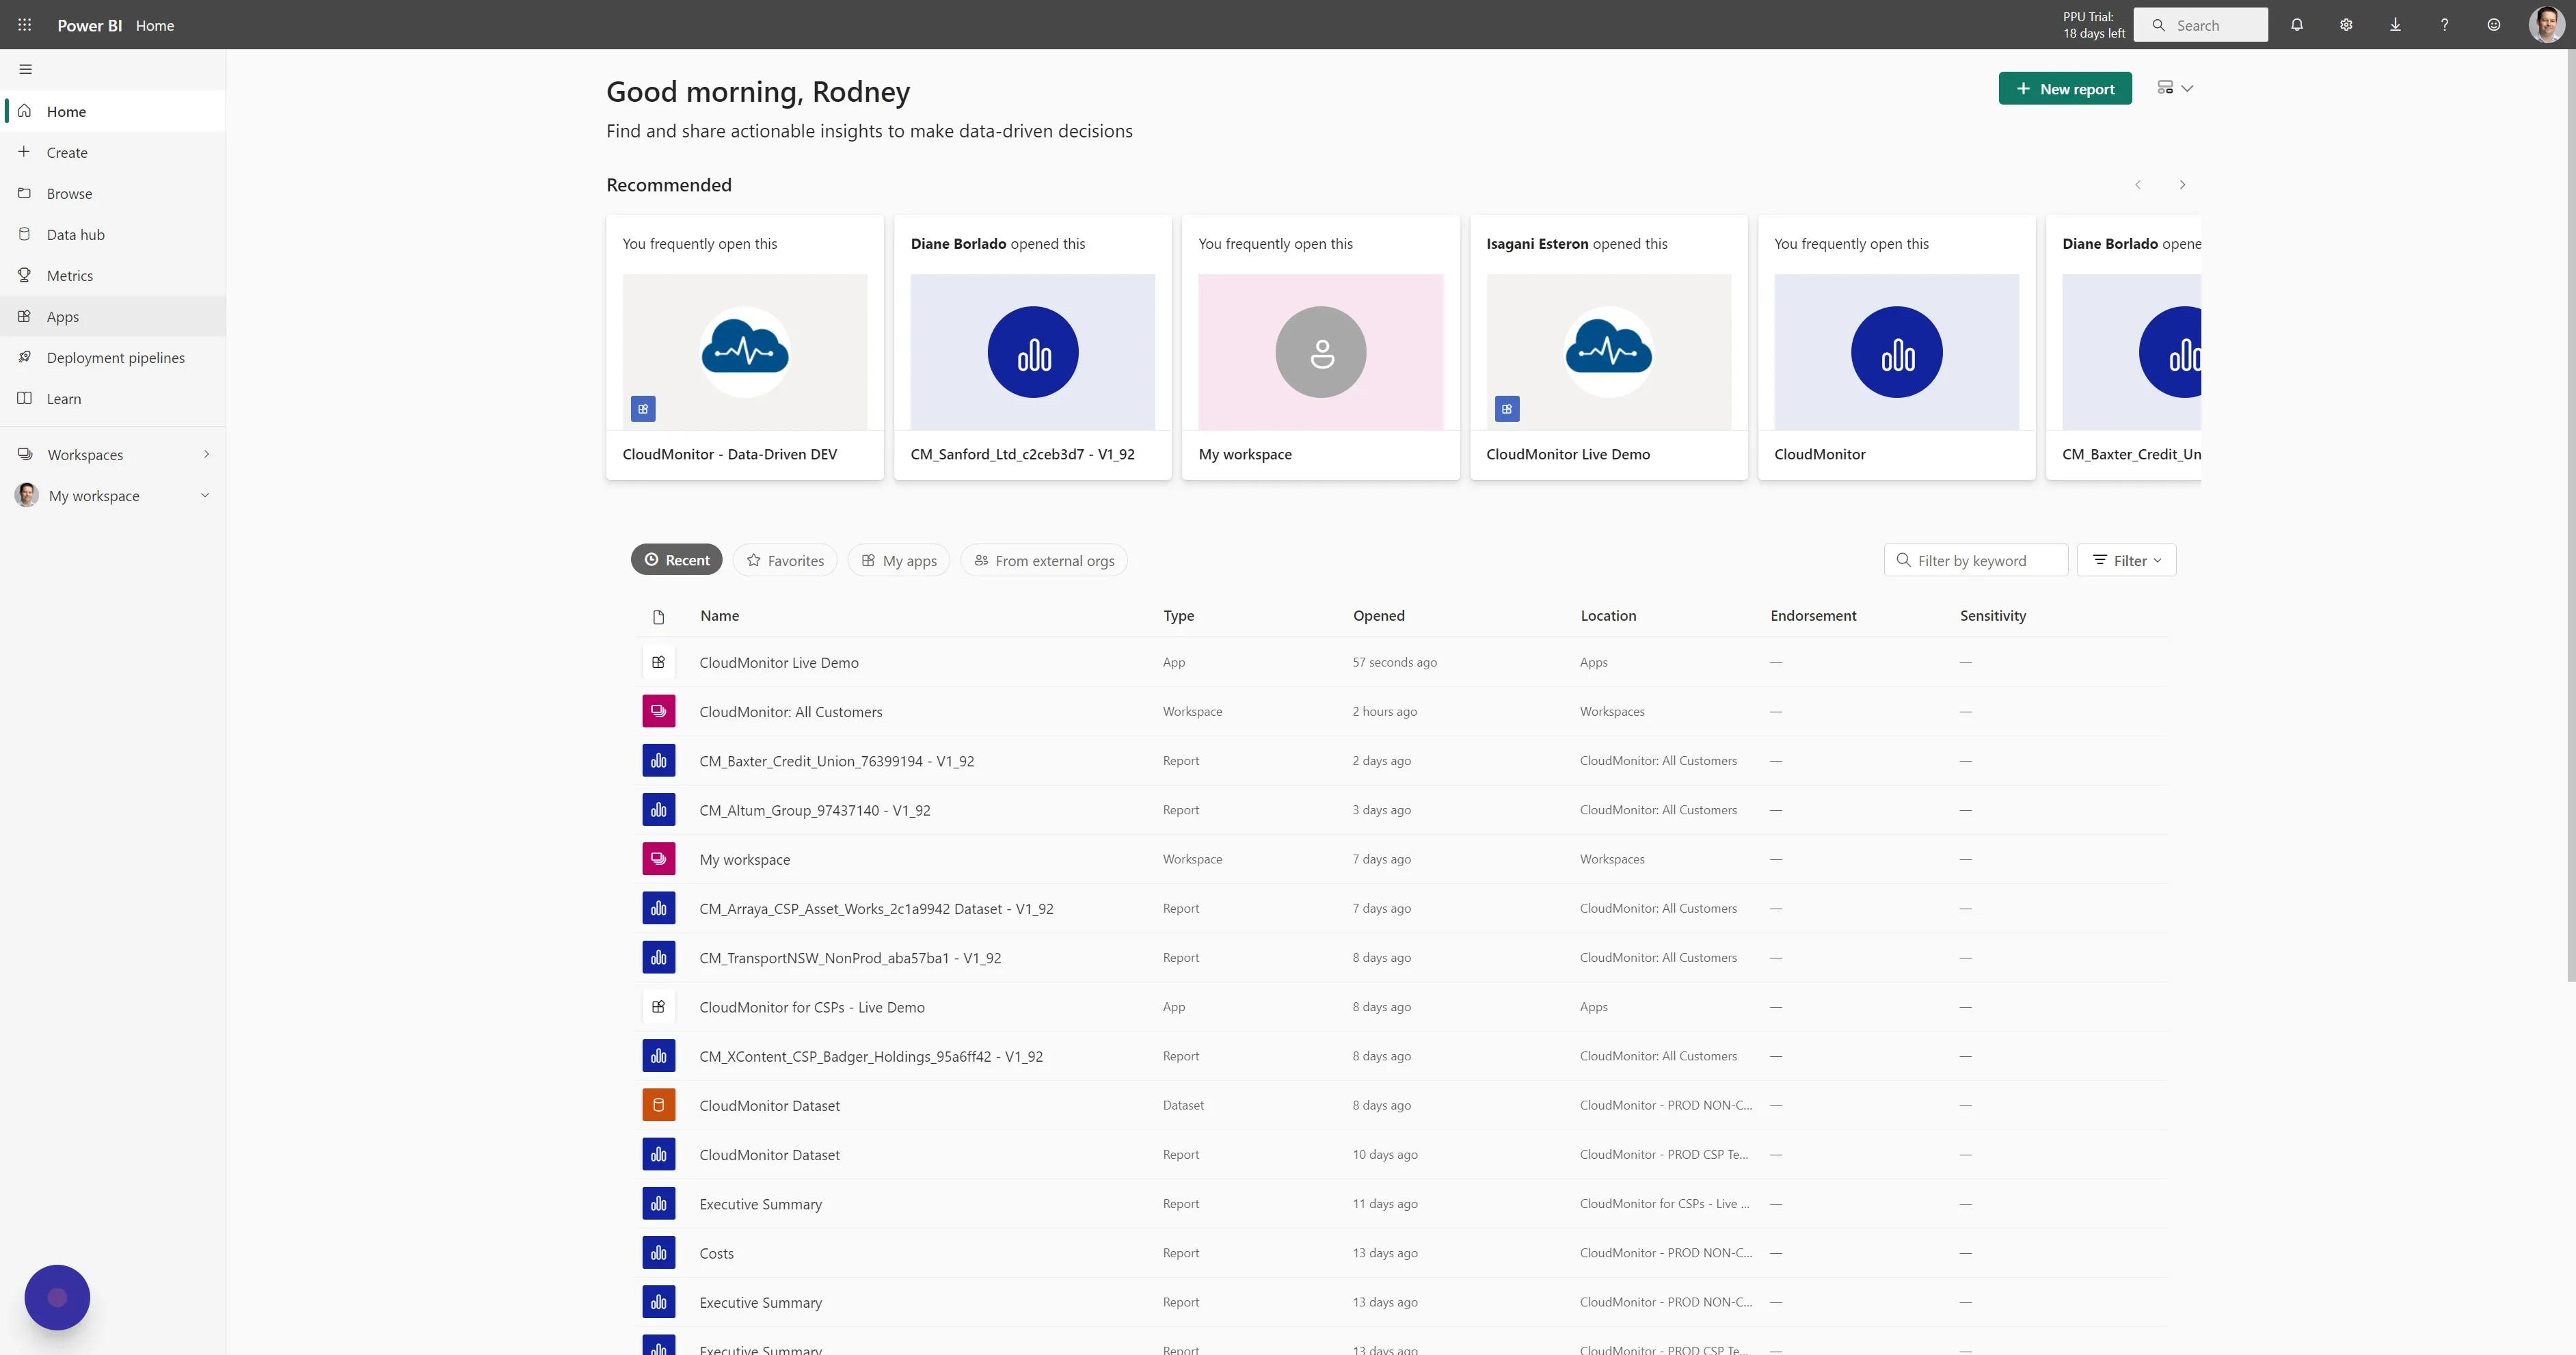
Step 1
Section titled “Step 1”Click “Go back” on the bottom left of the CloudMonitor application to go to the list of Power BI apps that you have installed.
Step 2
Section titled “Step 2”Click “Apps”
Step 3
Section titled “Step 3”Find your CloudMonitor App and click on the 3 ellipses dots to show the menu and click on “Edit”
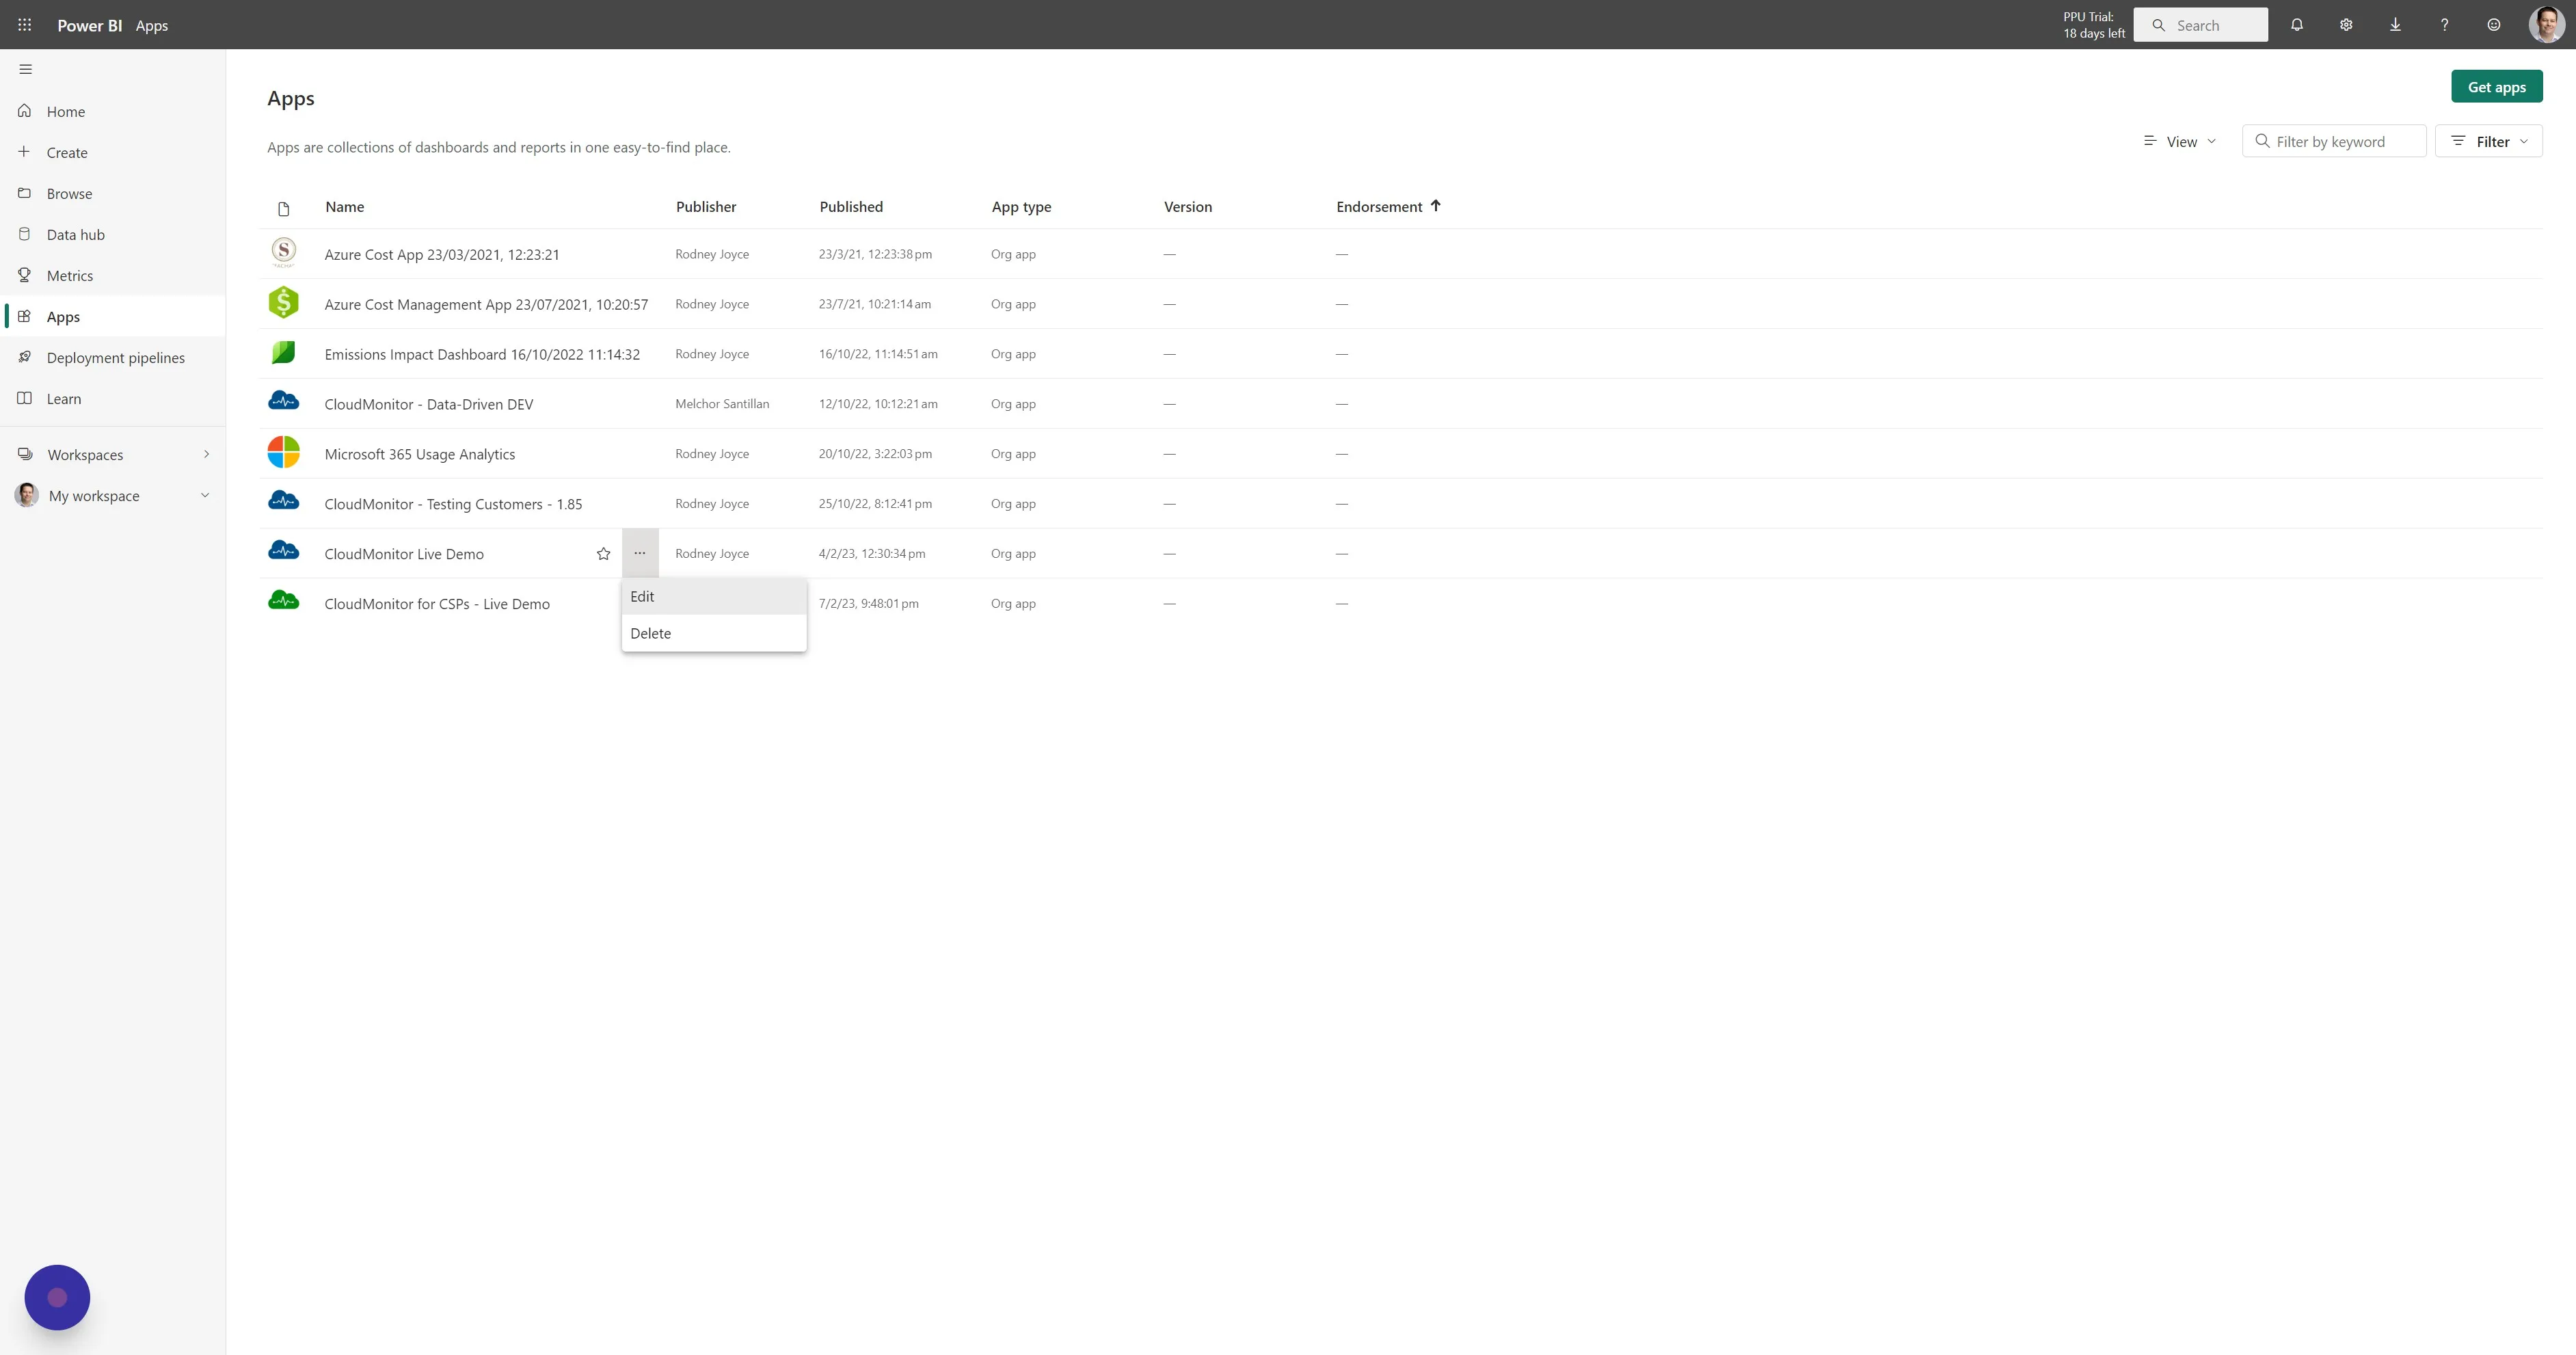
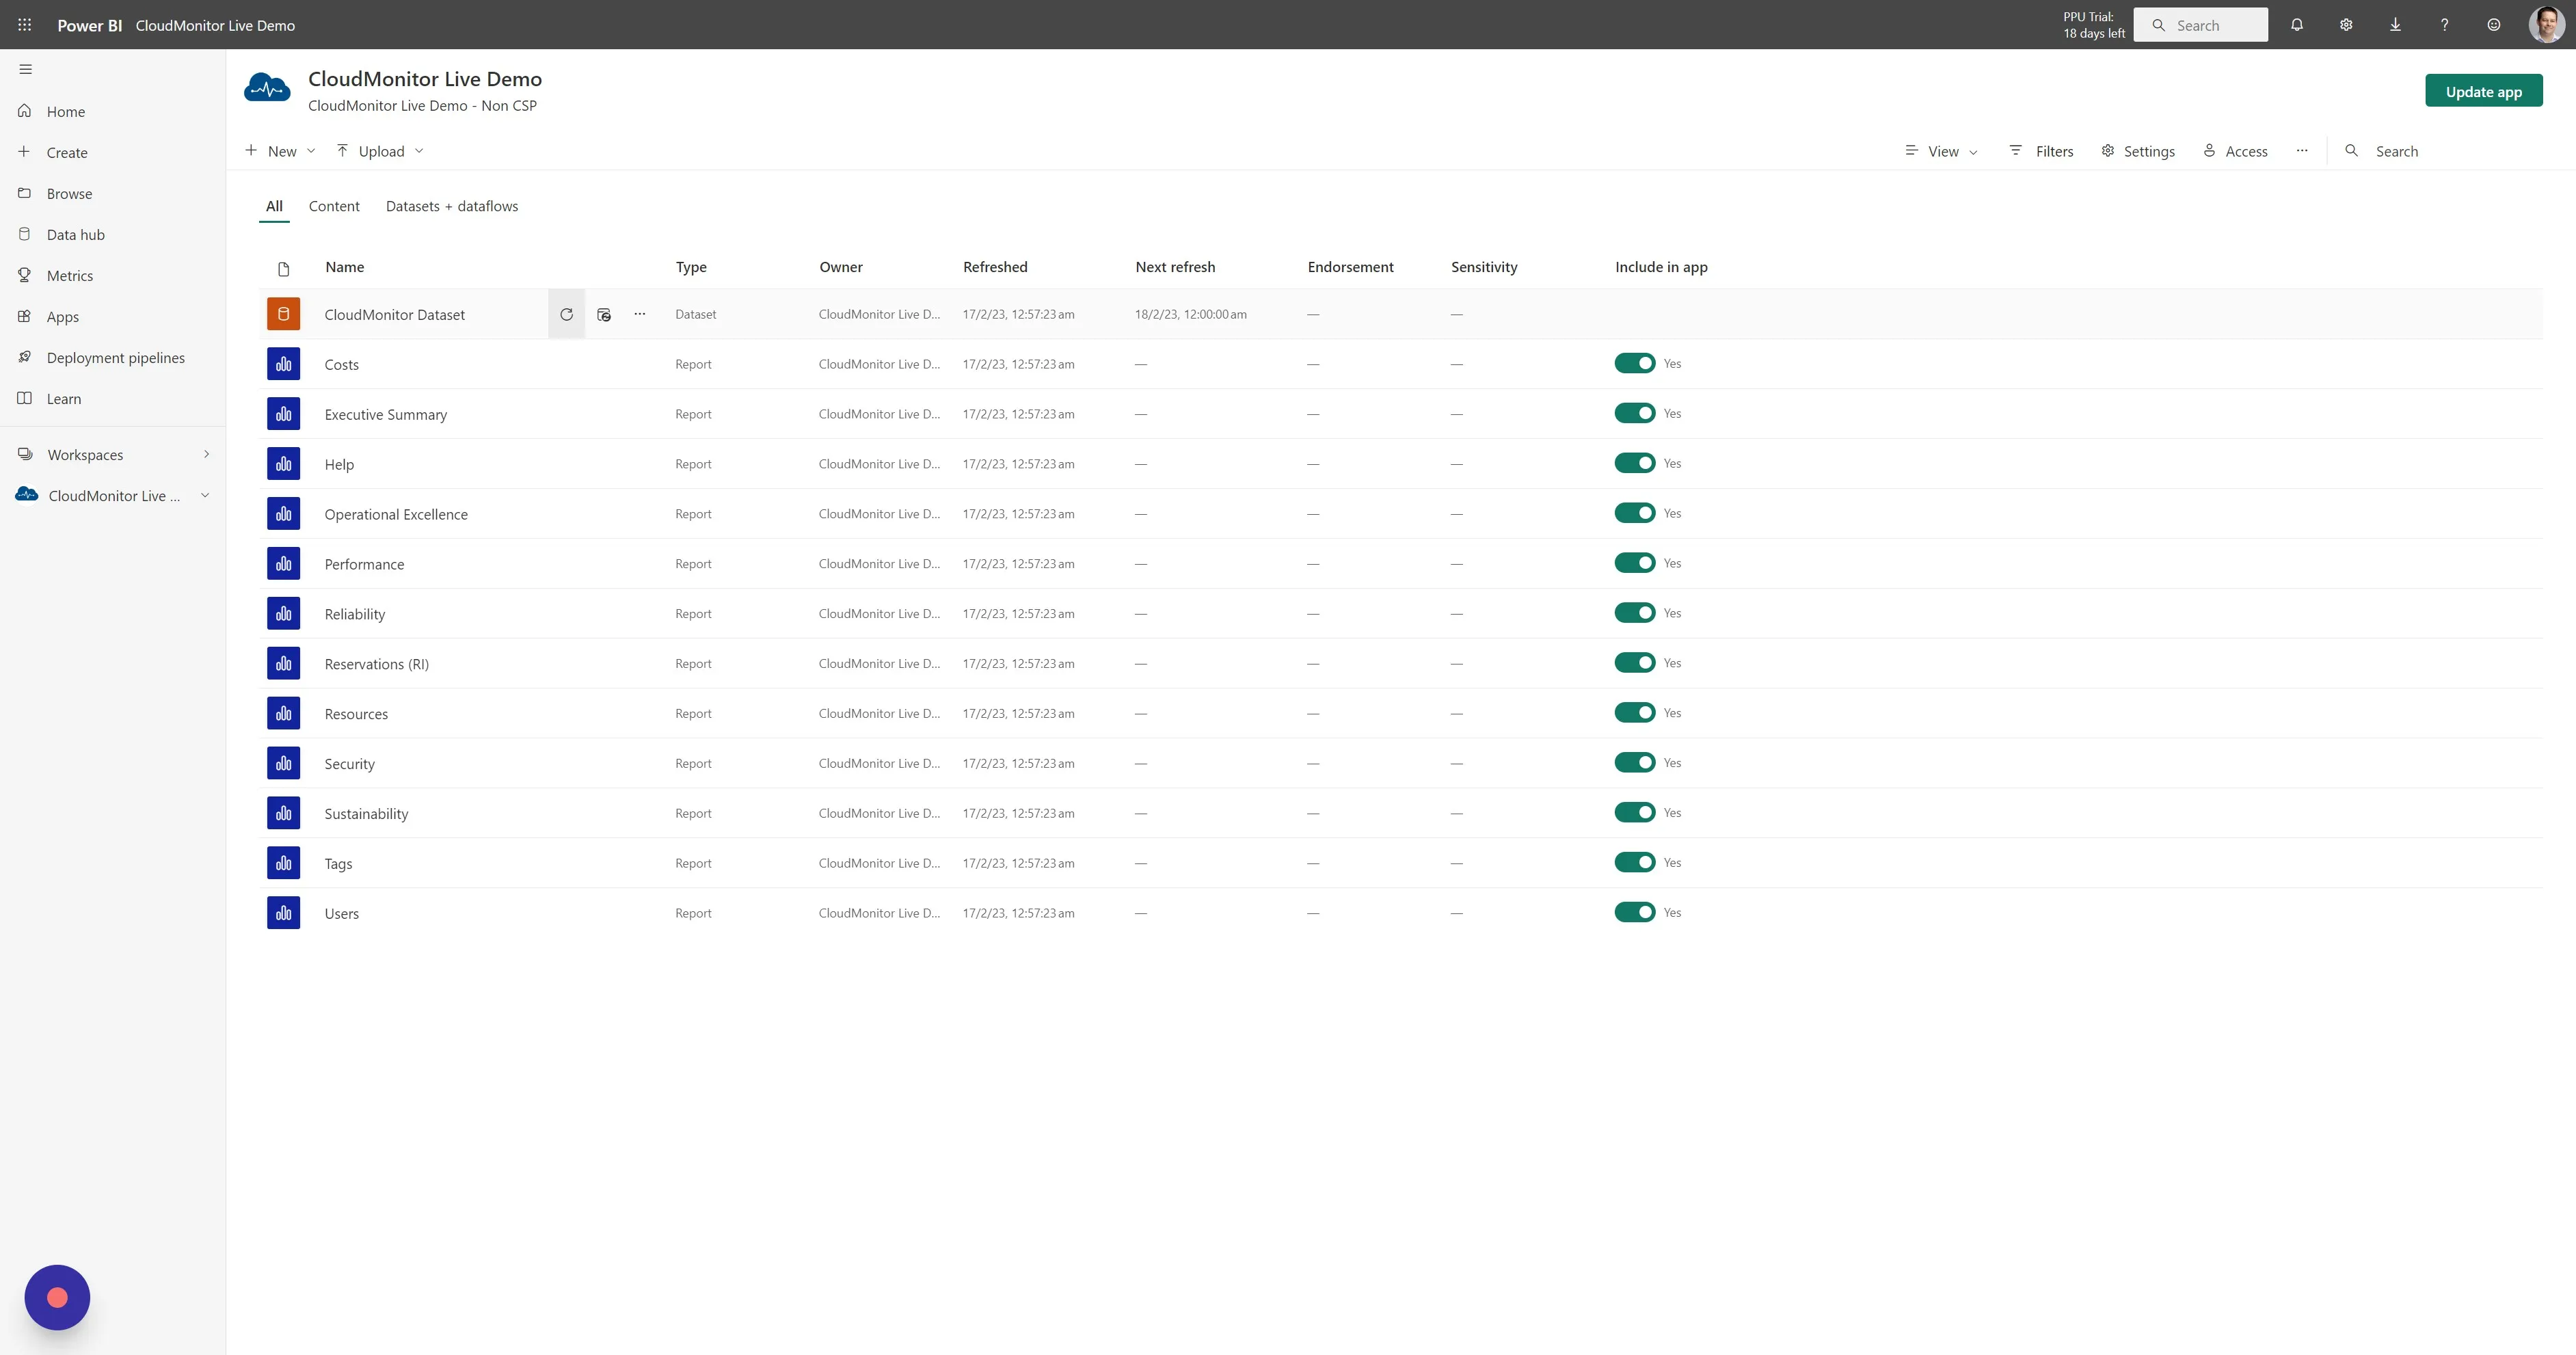
Step 4
Section titled “Step 4”Find the CloudMonitor Dataset and click on the Refresh icon to initiate a manual refresh of the dataset. A little moving icon will appear to show you that the dataset is being refreshed. This can take between 10 and 60 minutes depending on the size of your Azure estate.
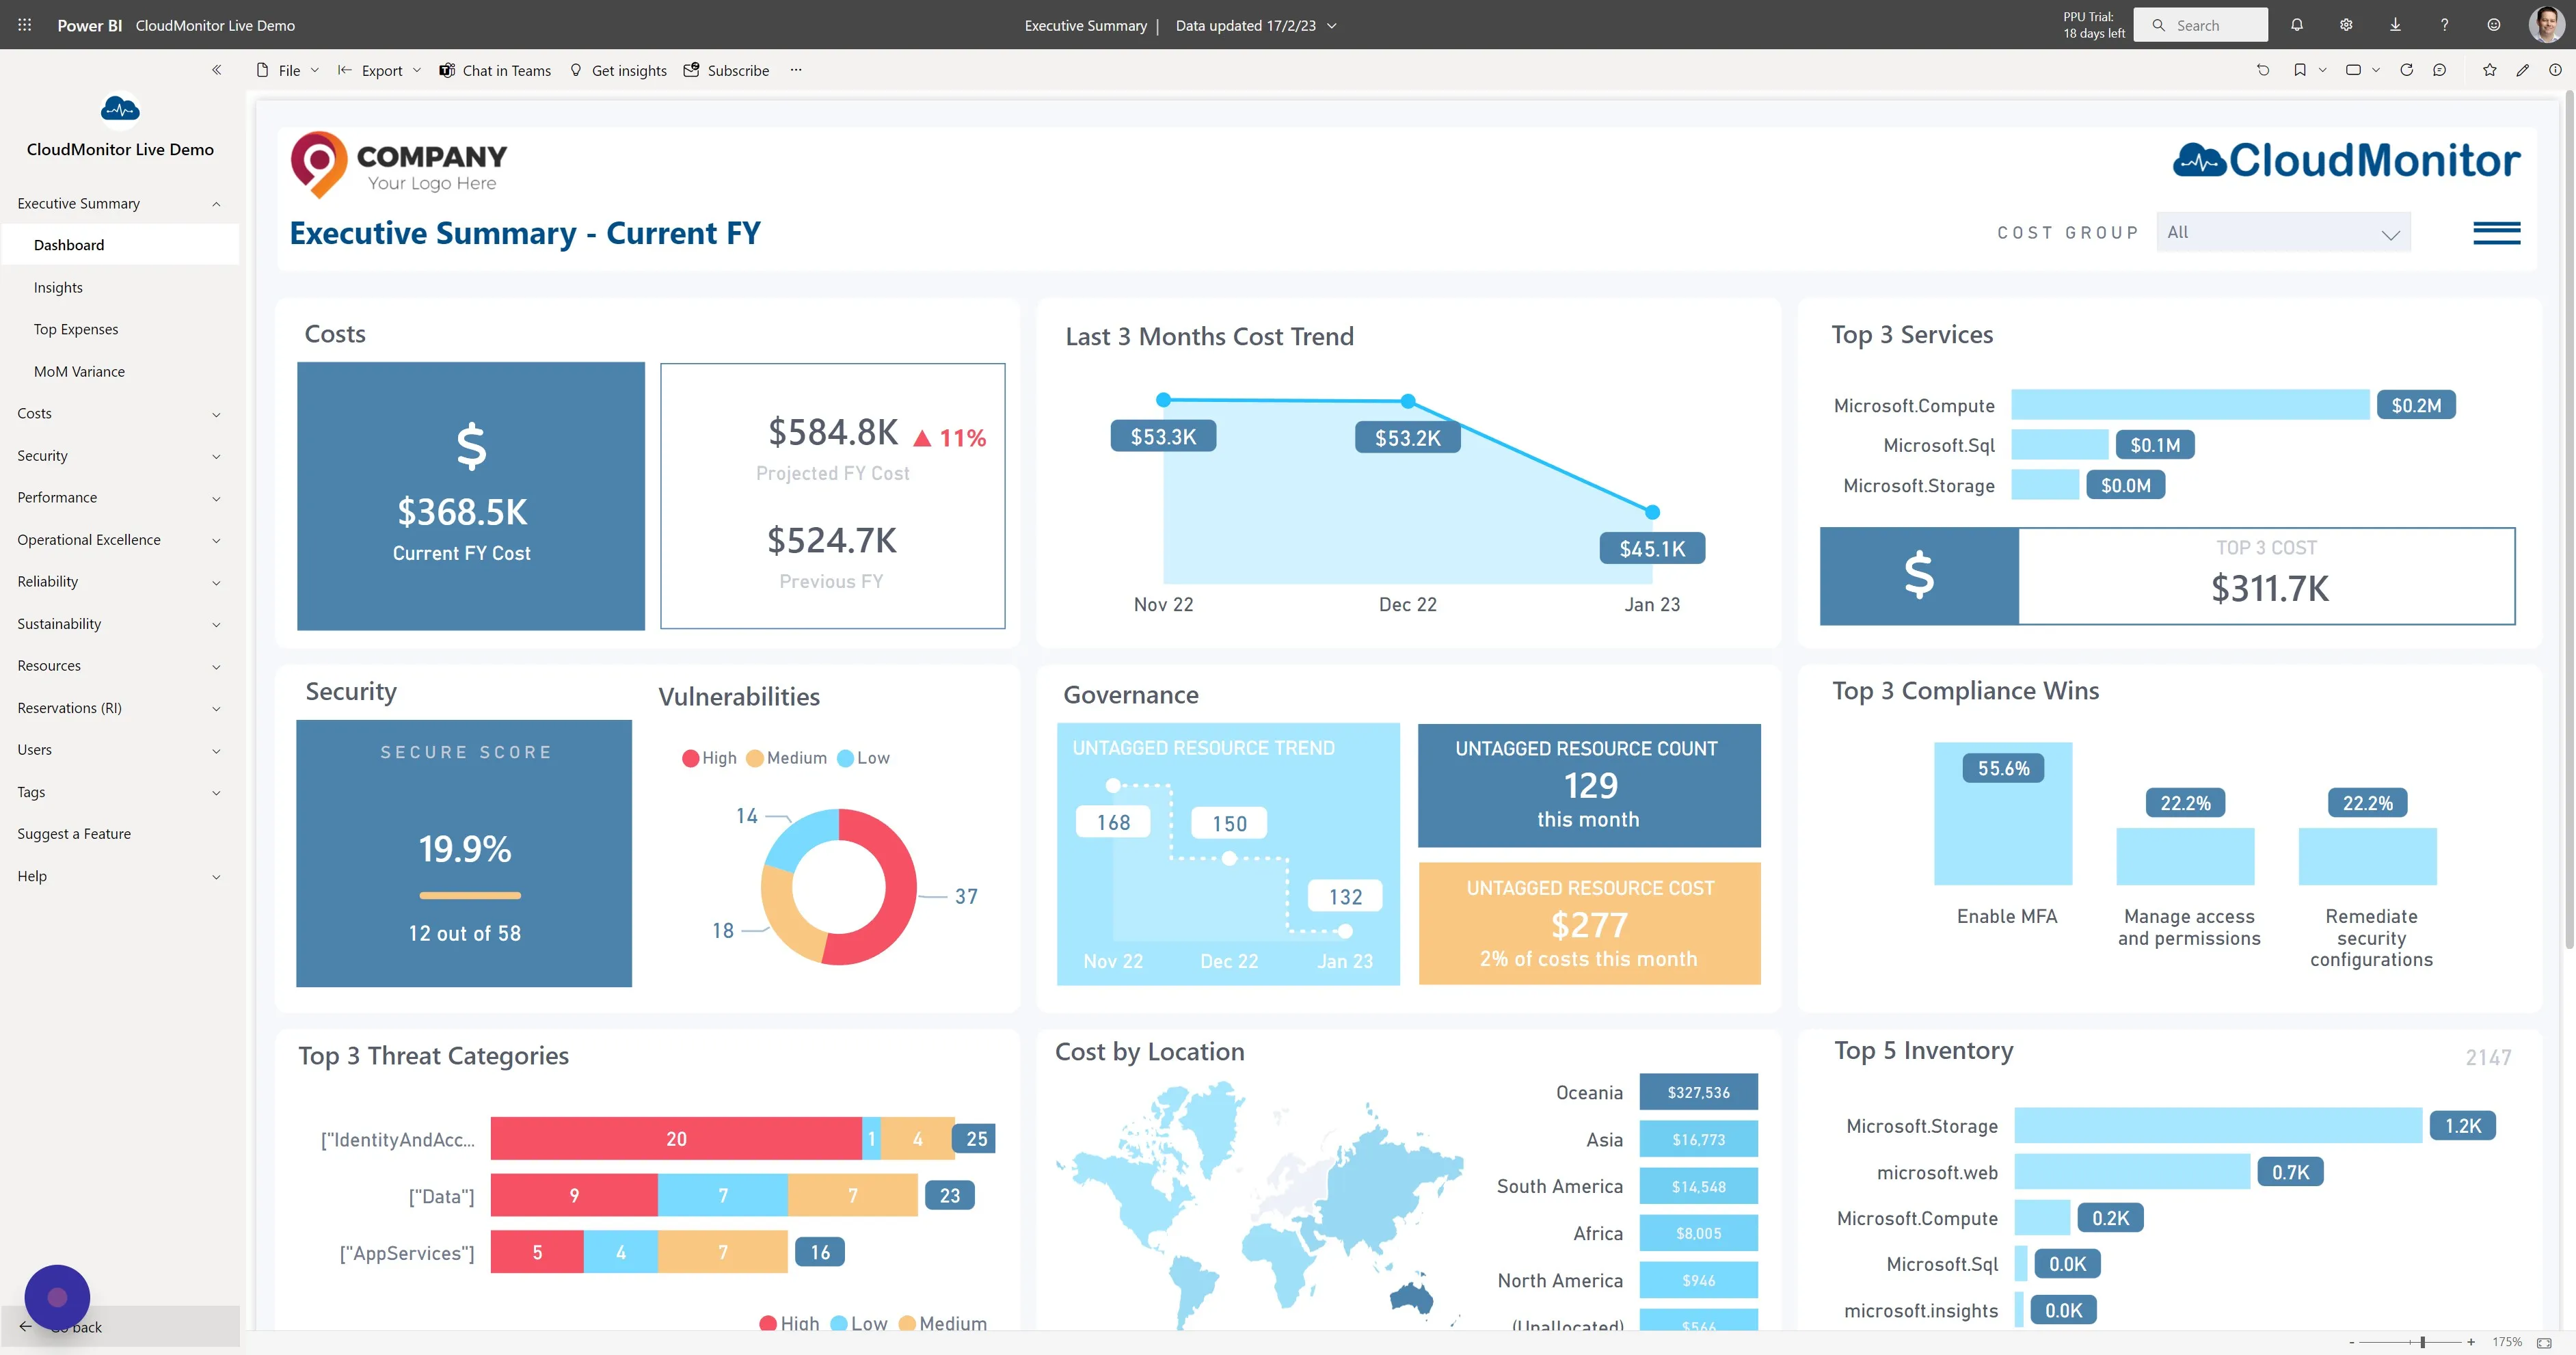
Step 5
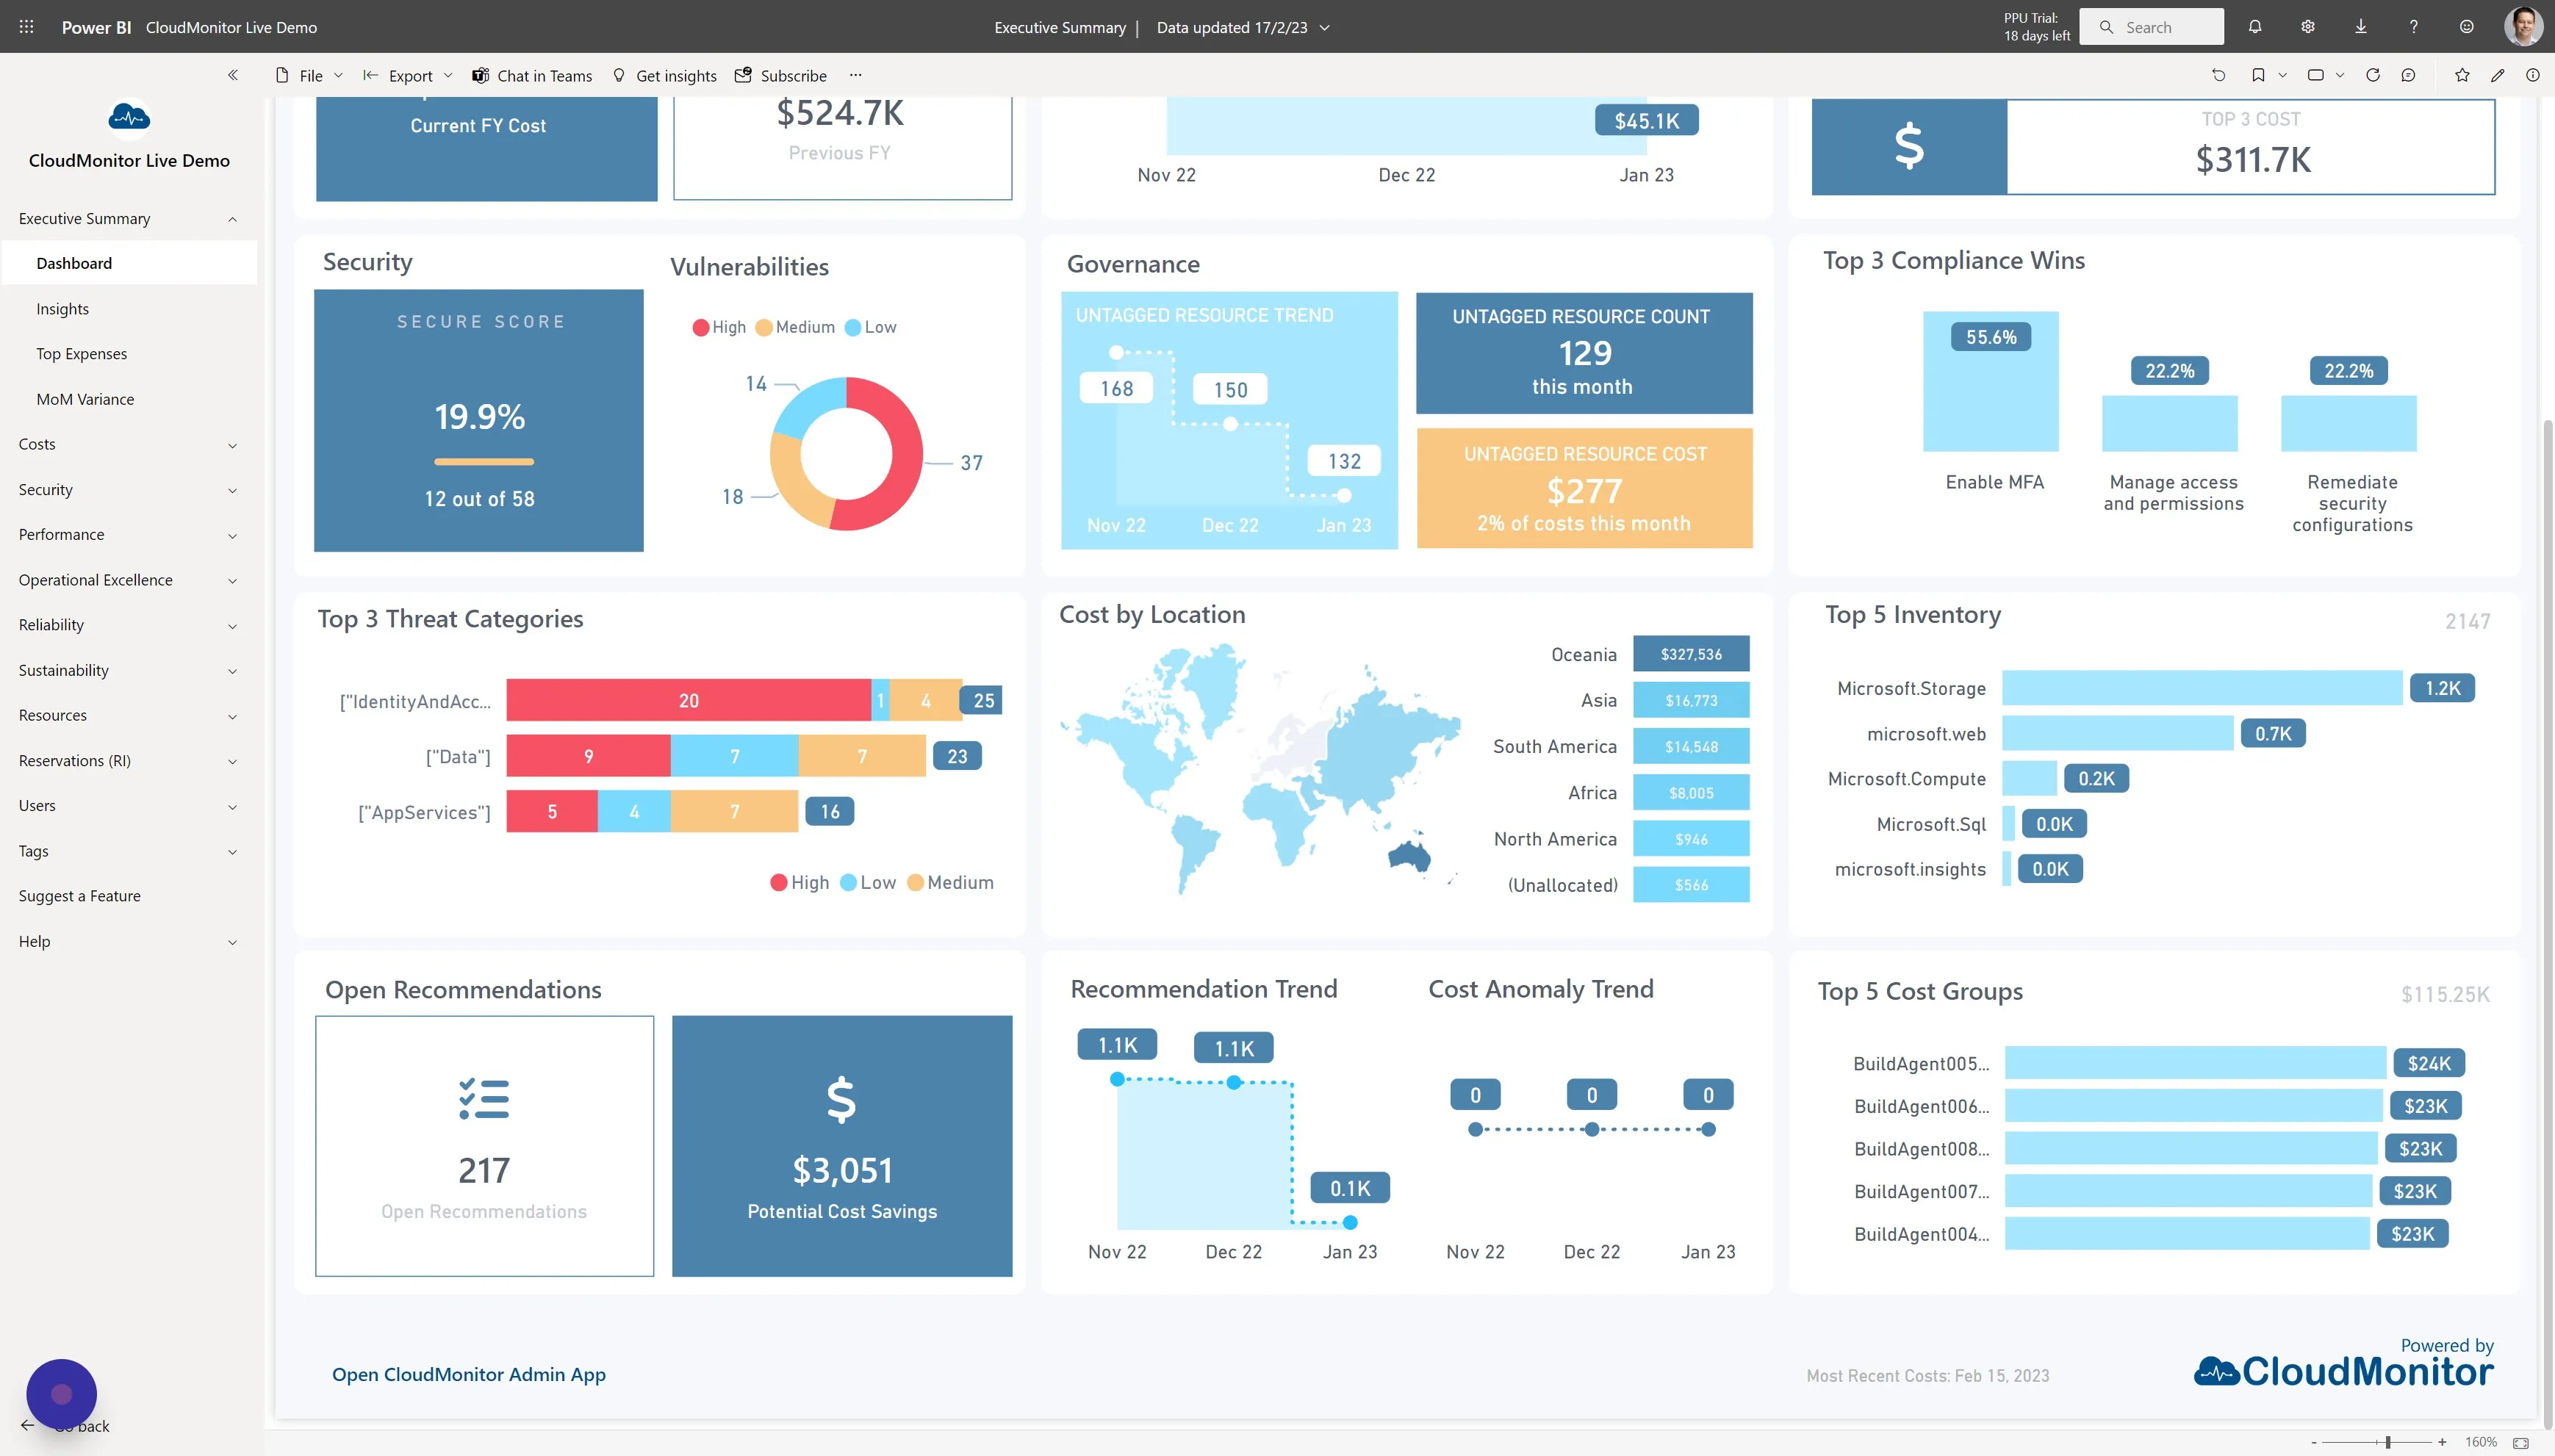
Section titled “Step 5”Once the Dataset has finished refreshing, open the CloudMonitor app and click on the Refresh Visuals icon in the top right (this does not cause a Dataset refresh, it just refreshes the state of the UI)
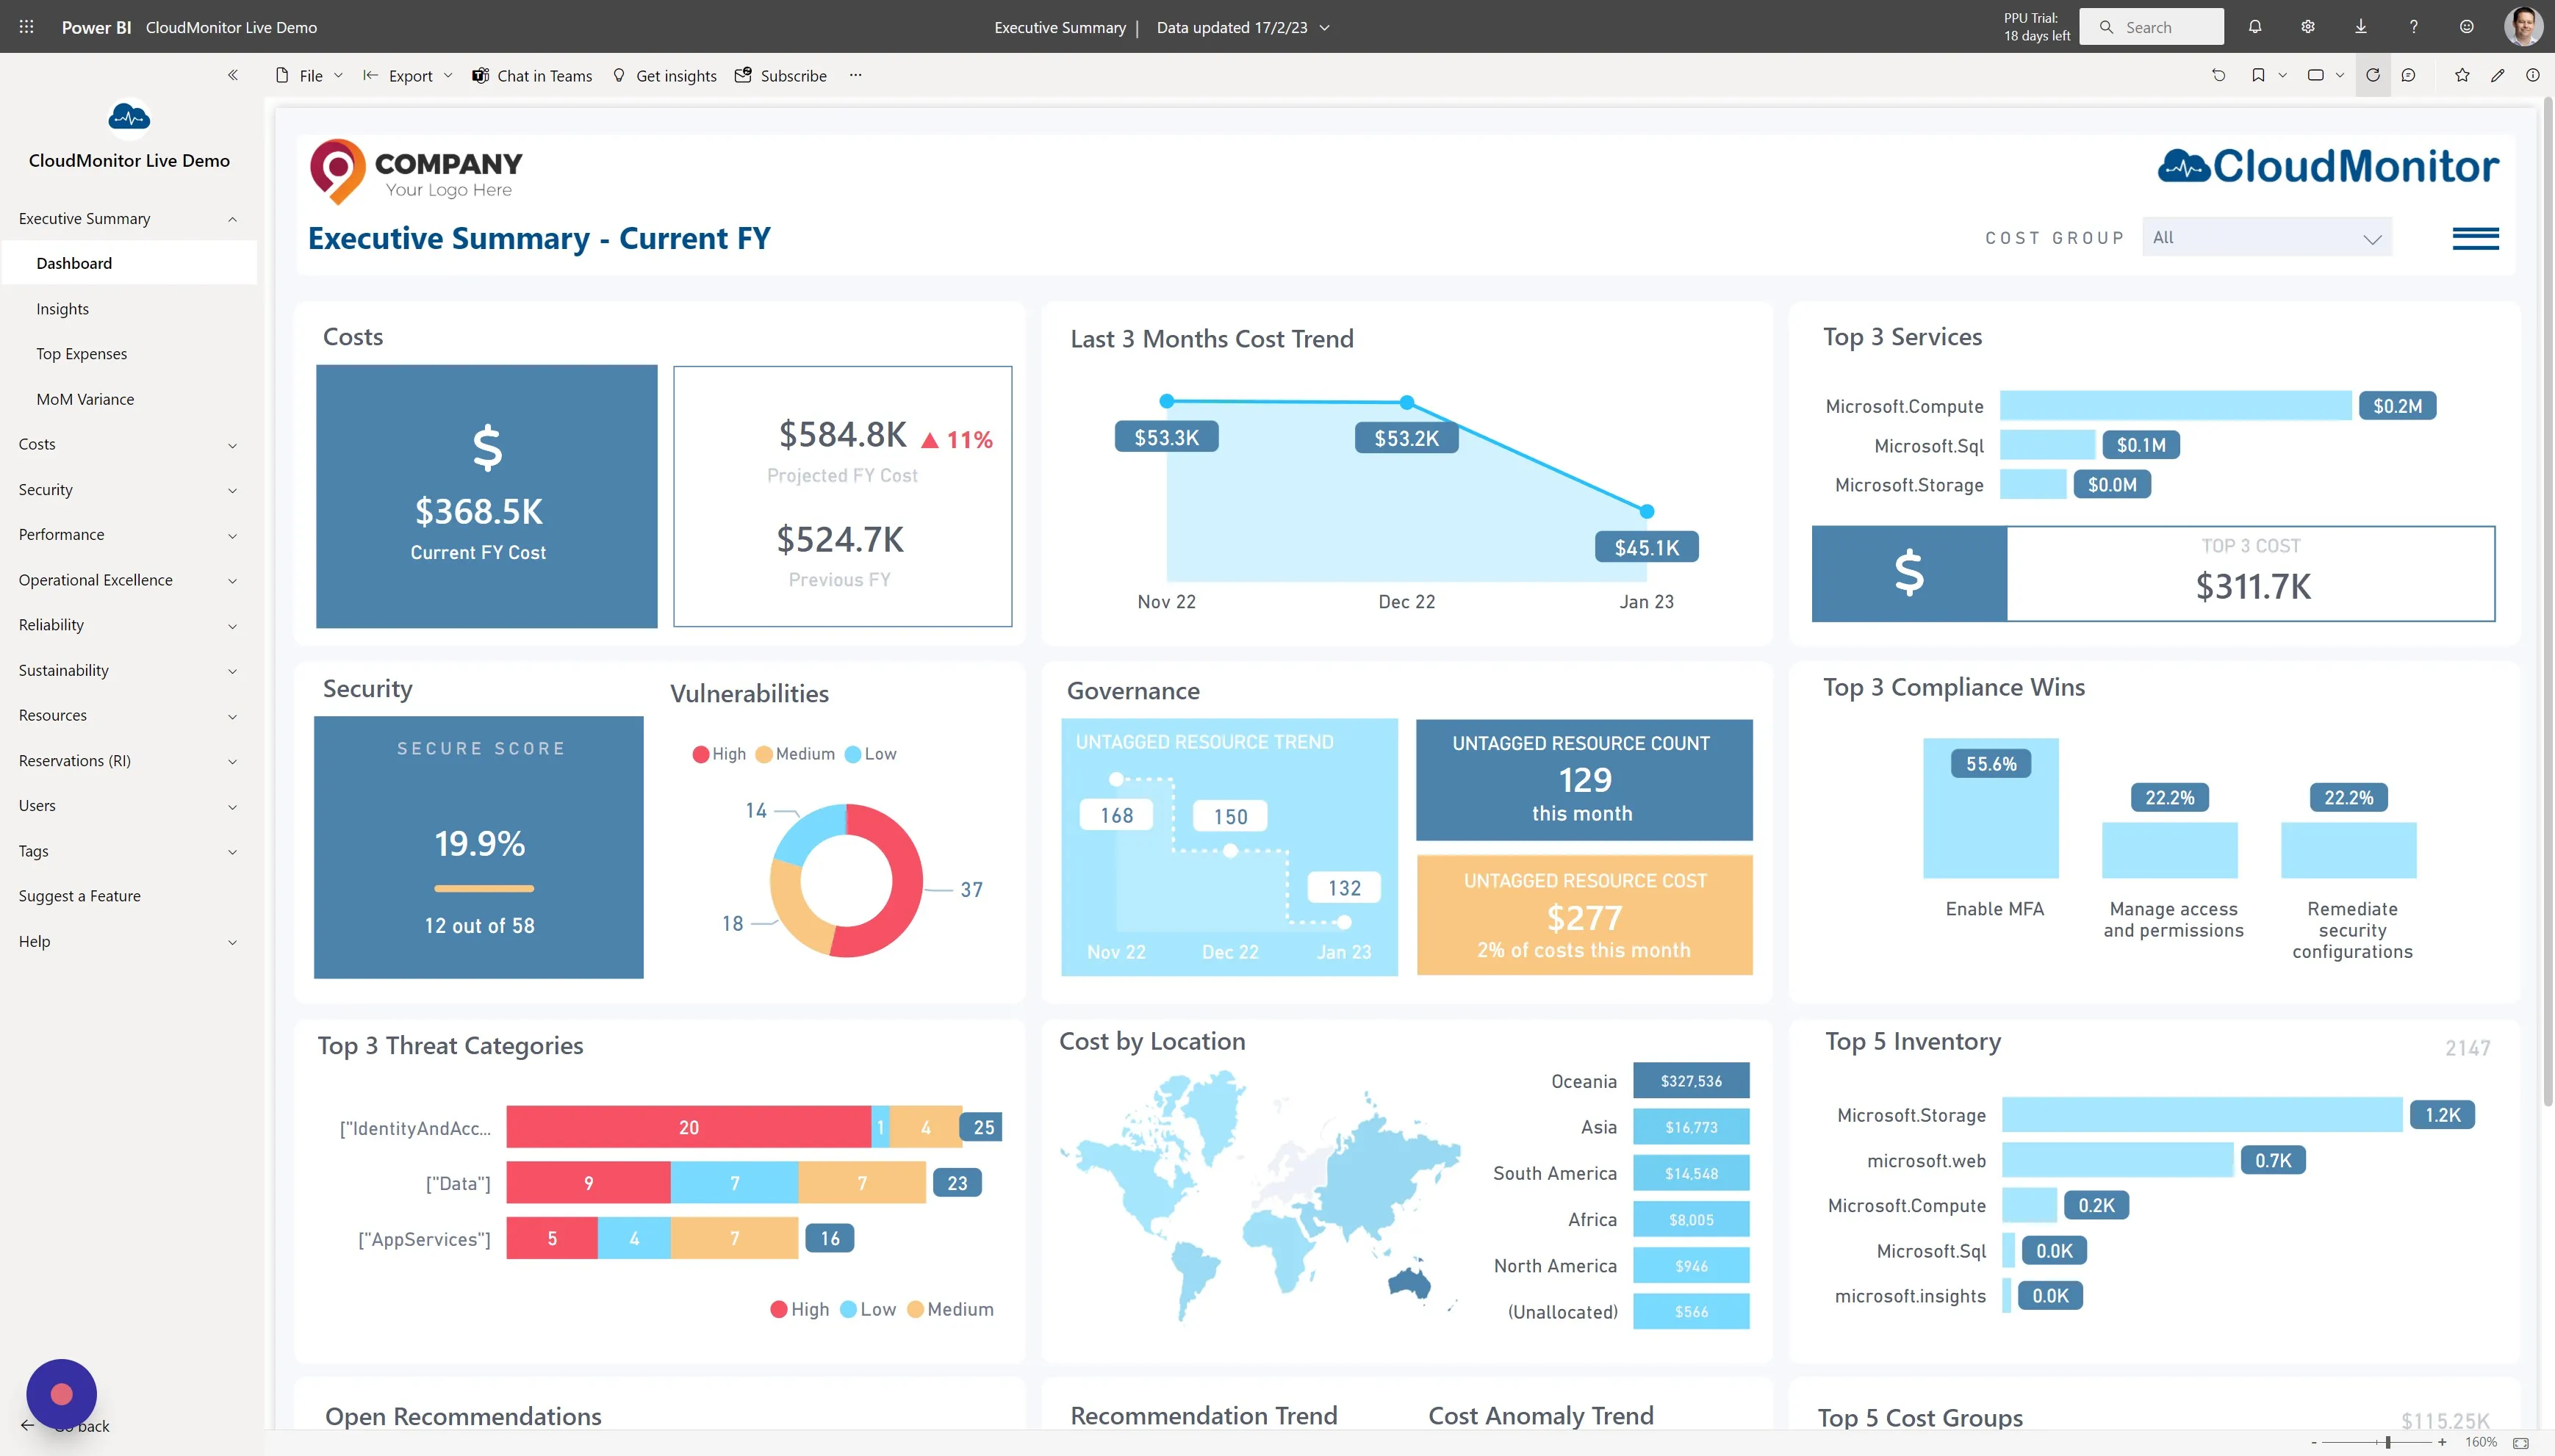
Step 6
Section titled “Step 6”At the bottom of the Executive Summary Dashboard you can see the date of the most recent cost records and when it was last refreshed. Your report should now be up to date!