AI Spend reports
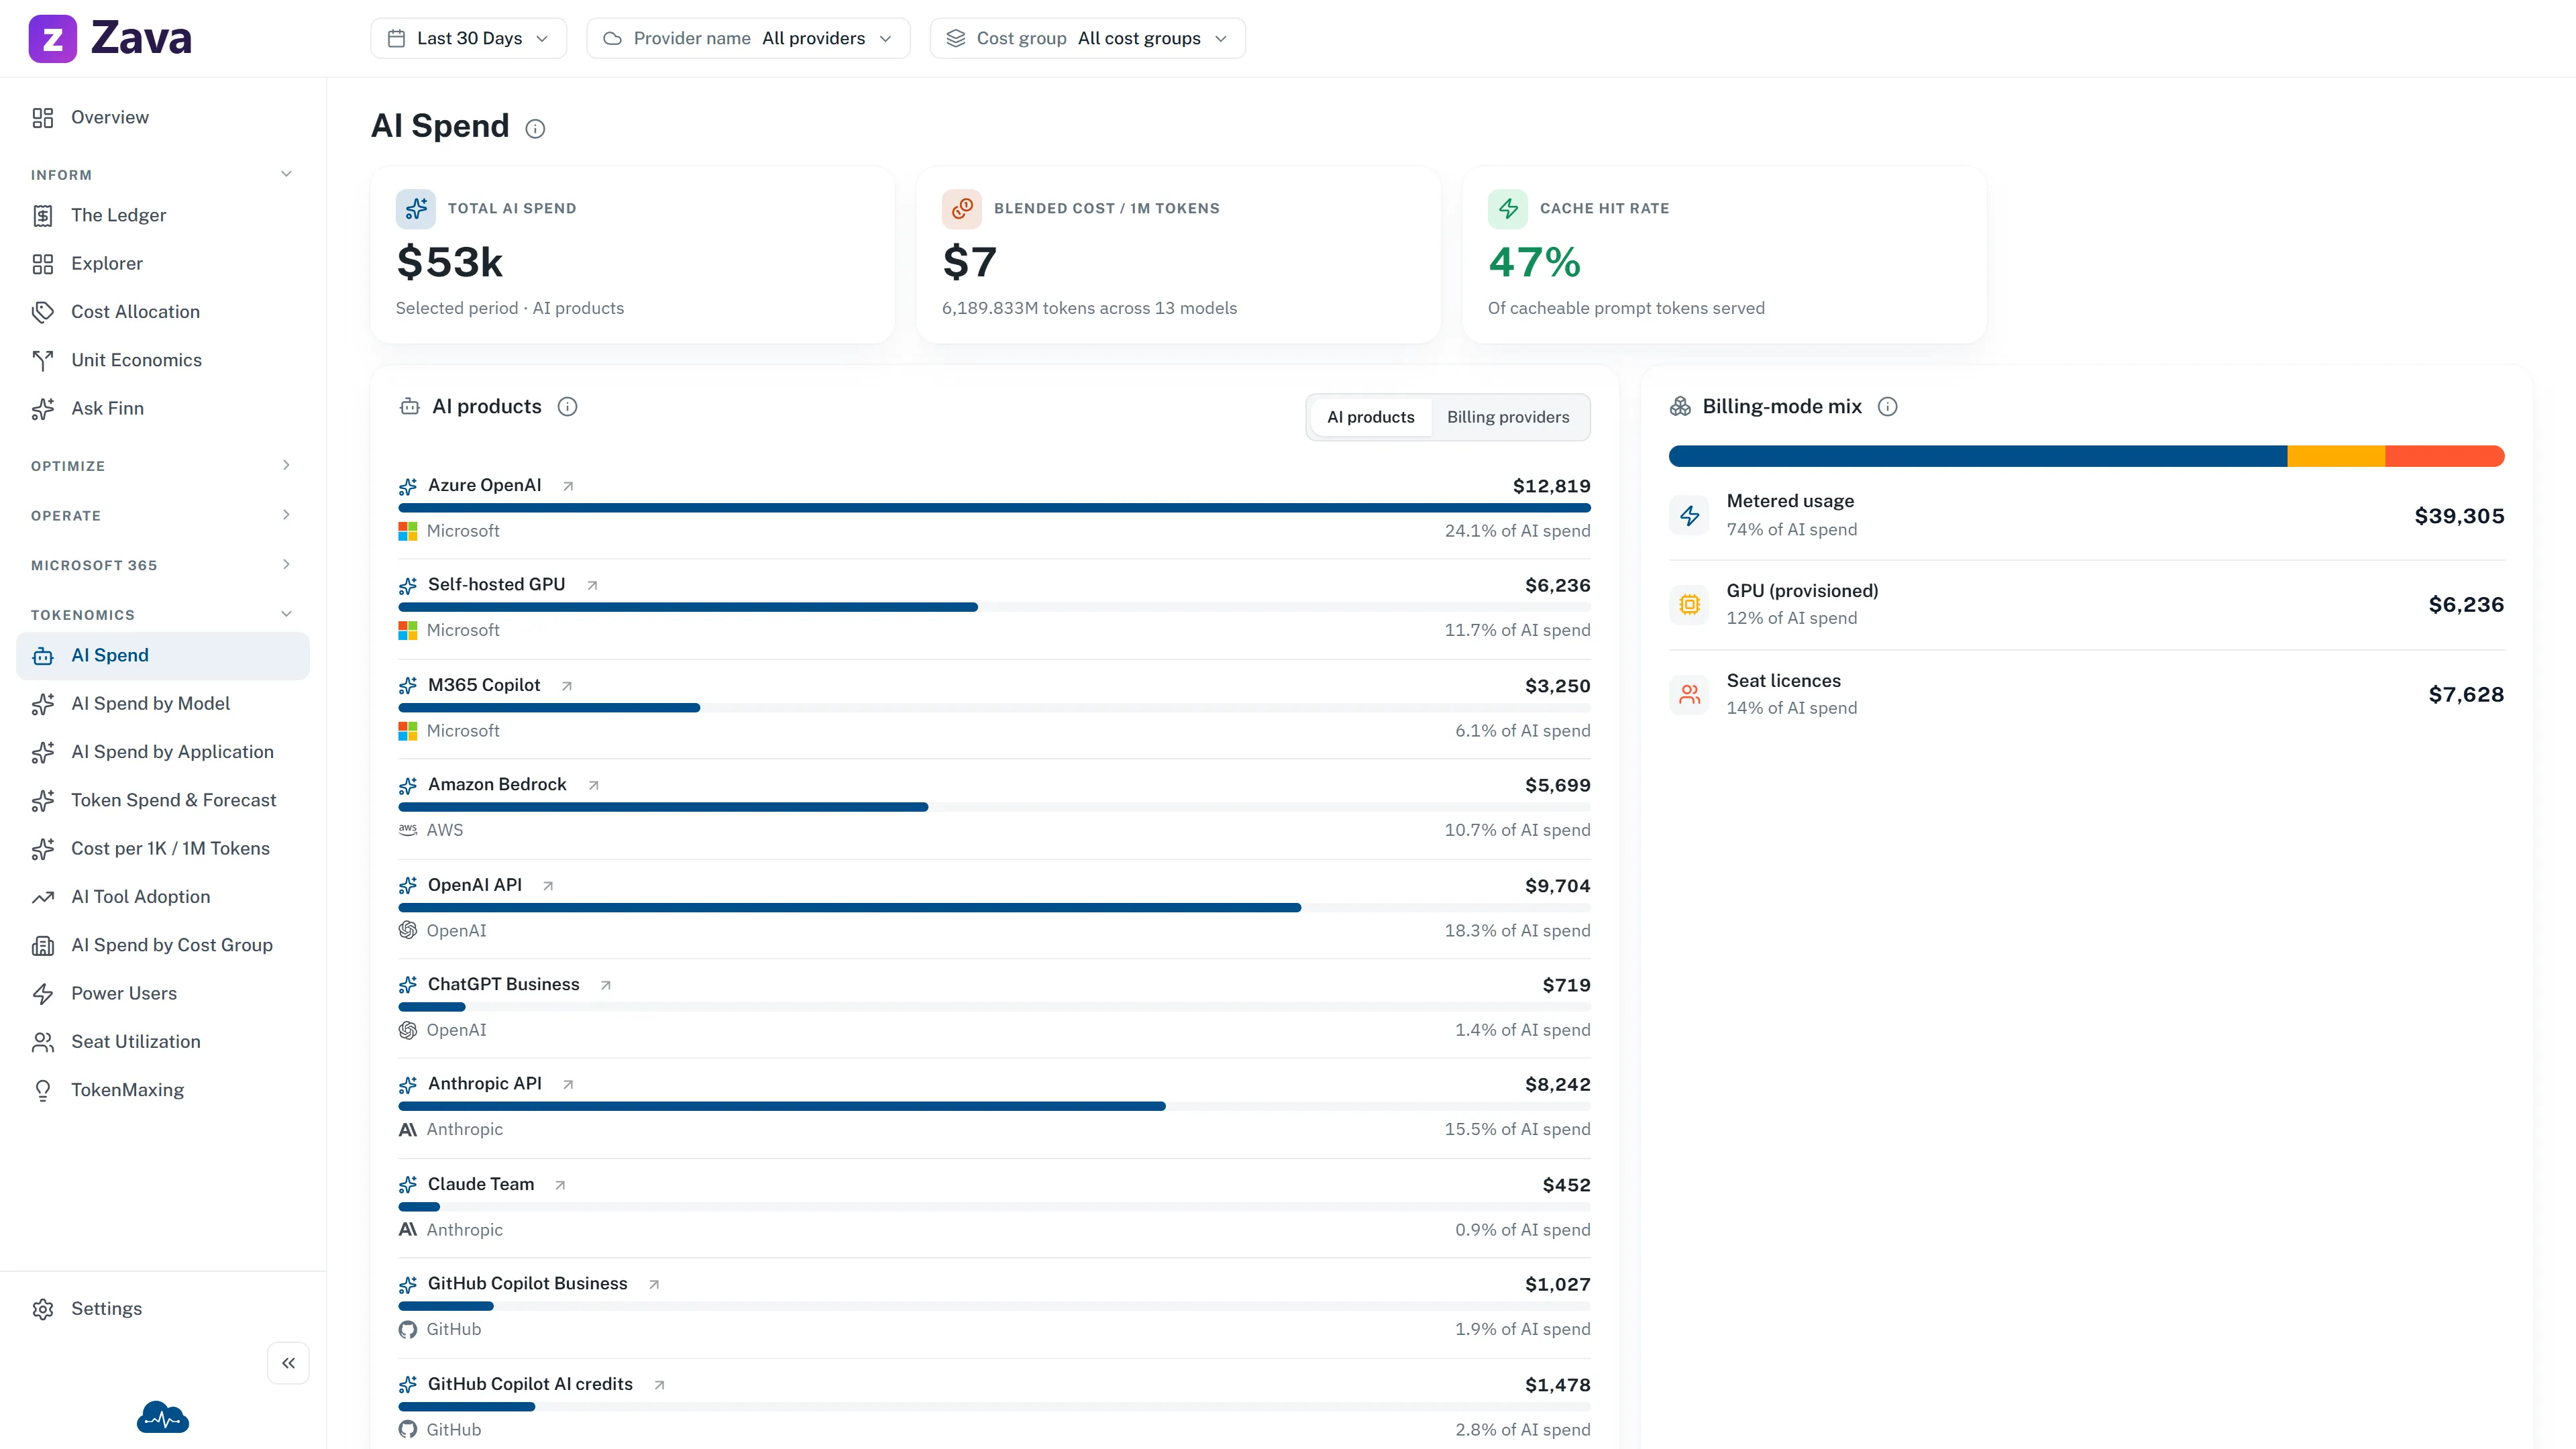
AI spend behaves unlike anything else on your bill. It’s consumption-based with no capacity to rightsize, the unit price changes when someone switches model, and a single badly-written prompt loop can cost more than a server. It gets its own reports for that reason.
Five views
Section titled “Five views”| View | Answers |
|---|---|
| AI Spend | What are we spending, by provider — tokens, seats and compute together |
| AI Spend by Model | Which models, with the input/output mix and blended unit cost |
| AI Spend by Application | Which application, team and cost group the spend belongs to |
| Token Spend & Forecast | Where the month lands, against budget |
| Cost per 1K / 1M Tokens | The unit rate over time, and the cache-hit rate driving it |
The number to watch
Section titled “The number to watch”Cost per 1K / 1M tokens is the AI equivalent of unit economics. Total AI spend going up while cost per million tokens goes down means you’re getting more work done more efficiently — a good month that looks like a bad one on the total alone.
Cache-hit rate is the biggest lever on that rate, which is why it sits on the same view.
What’s live and what isn’t
Section titled “What’s live and what isn’t”So: the cost figures are real, and a fine-grained token metric is either live or visibly absent. Nothing on this screen is an estimate standing in for a missing feed.
Filters
Section titled “Filters”Period, provider, cost group and cost basis all apply — the AI vendors are billing providers like any other, so the provider chip genuinely slices these views.
Virtual tags don’t: token telemetry carries no resource tags, and the chip says so.
Where the other AI screens are
Section titled “Where the other AI screens are”This report is about cost. The adoption question — who’s using which tool, and are the seats worth it — is on AI tool adoption, and the optimization suggestions are on TokenMaxing.