The Cost Groups report
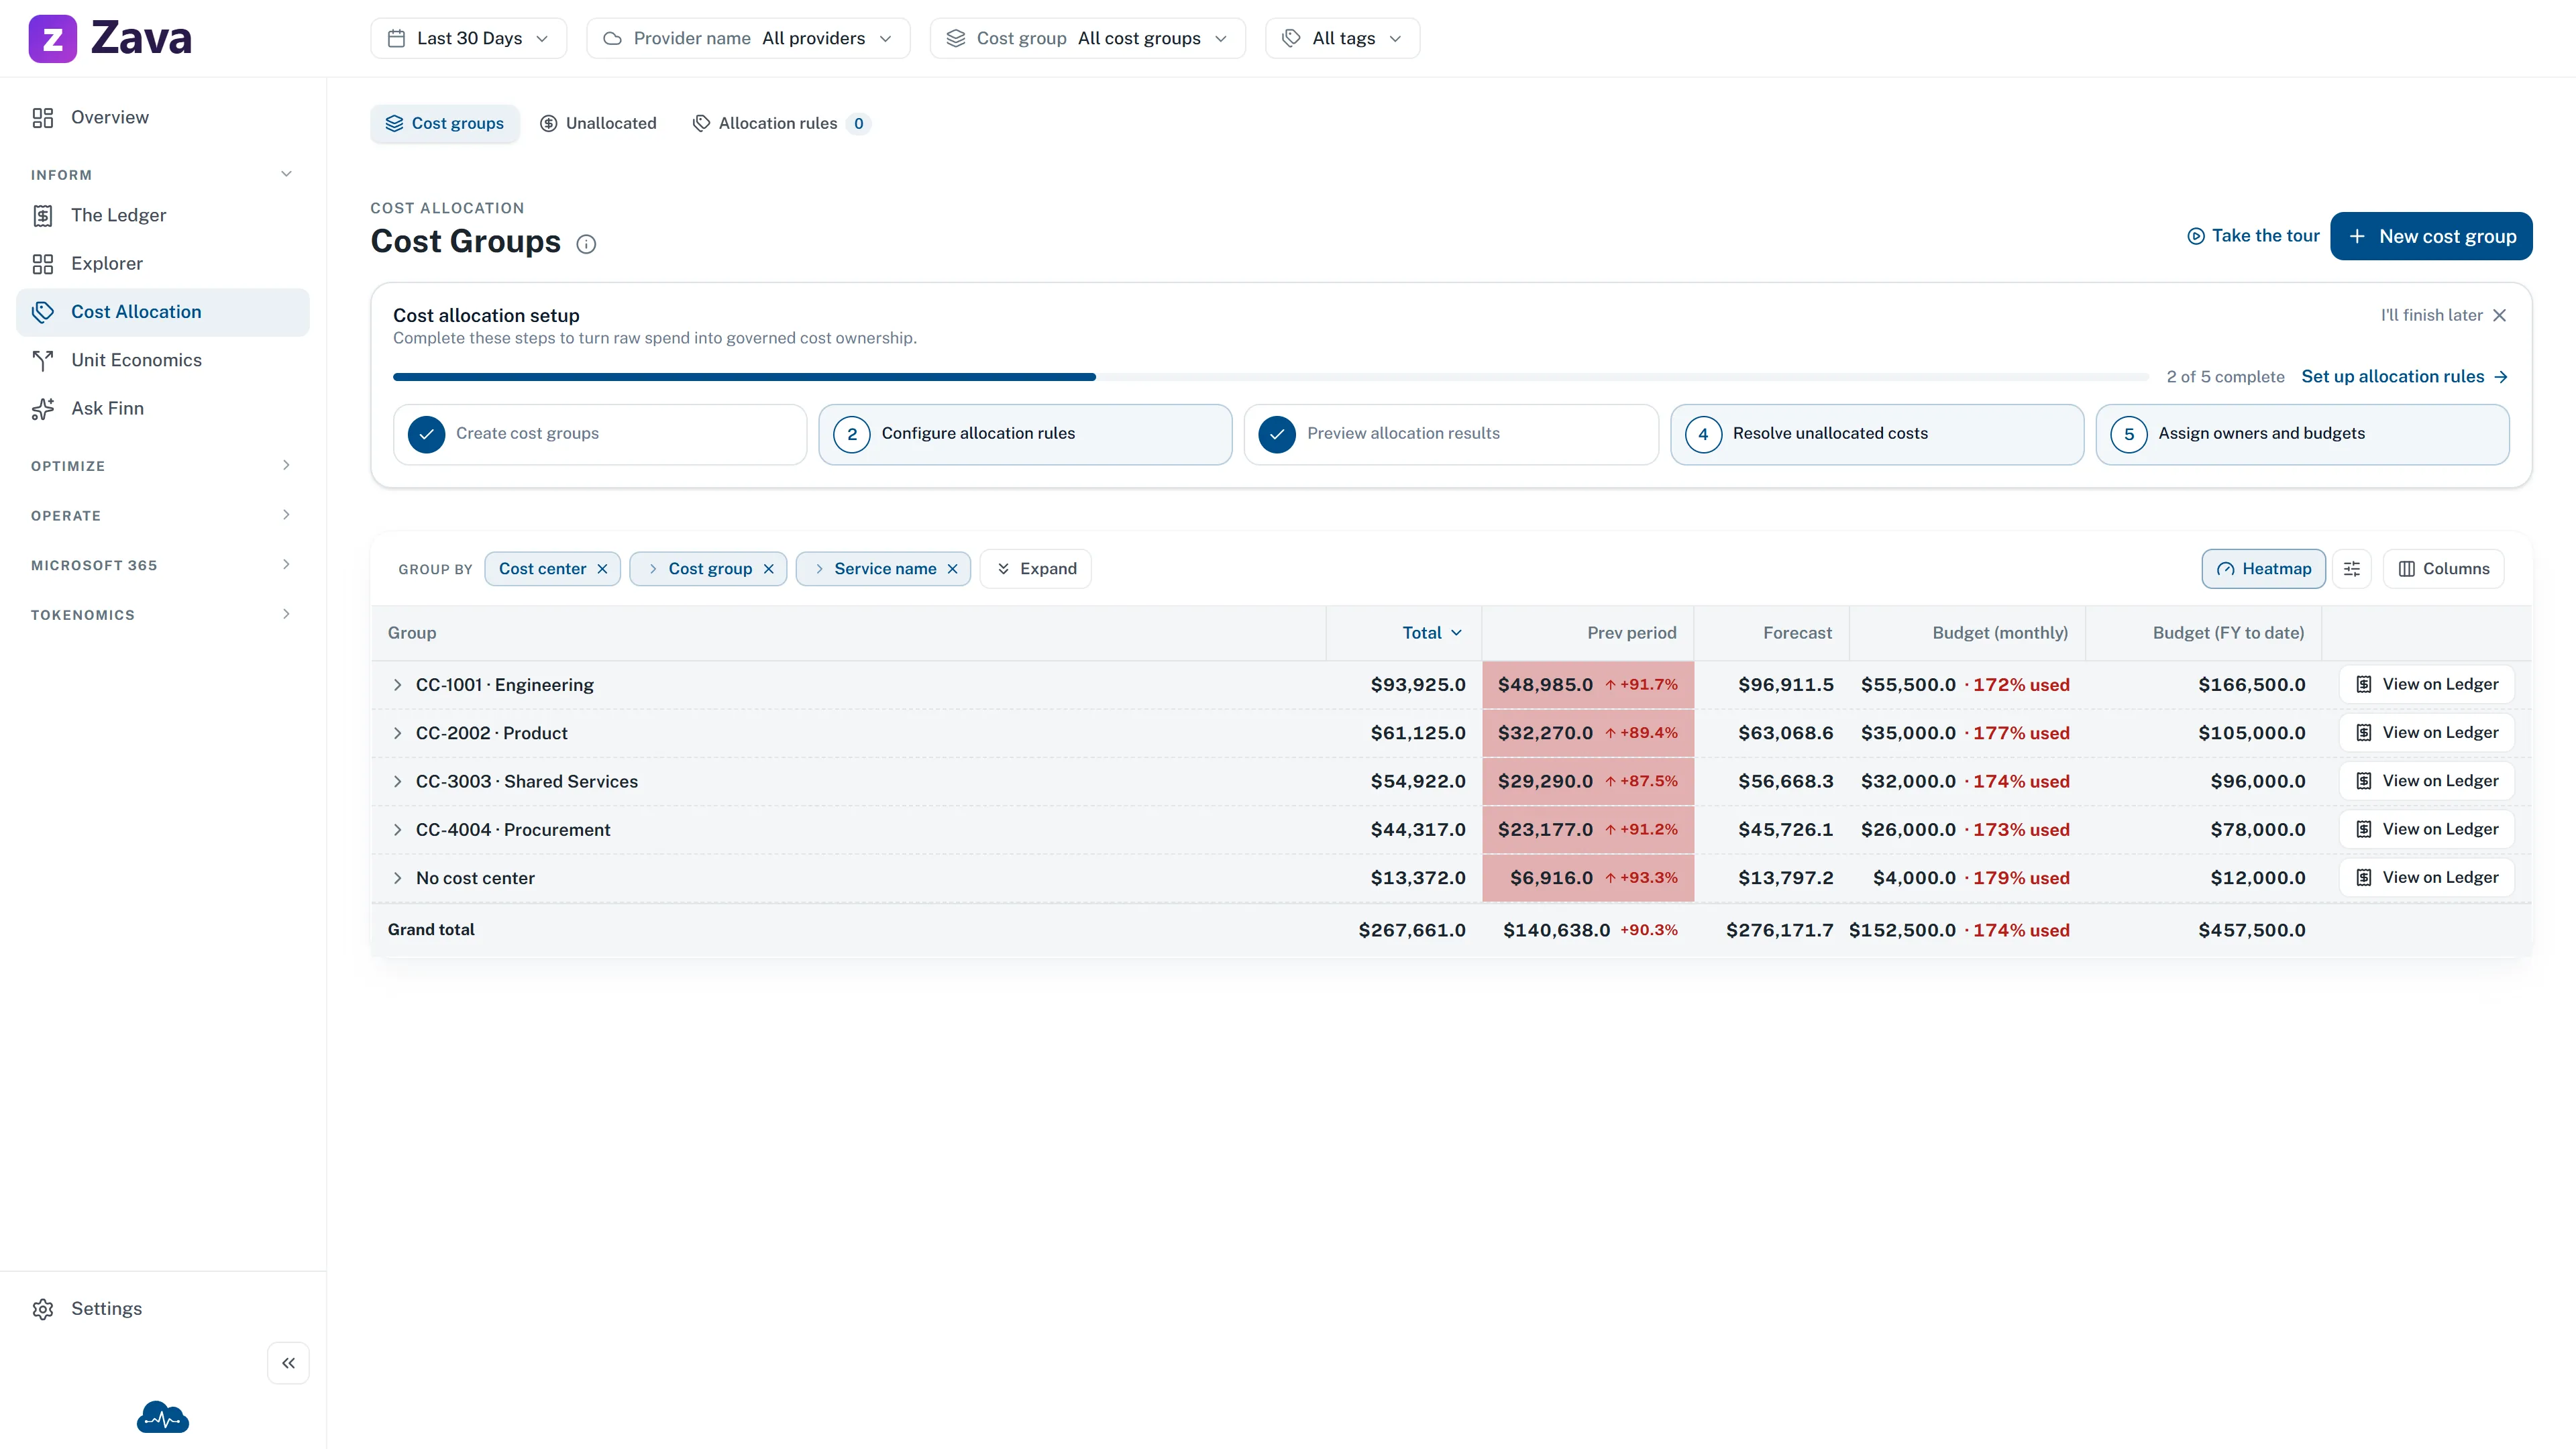
Every cost group’s spend for the period, side by side. This is the report you open before a budget conversation or a chargeback run.
What’s in the table
Section titled “What’s in the table”It’s a cost grid, so it groups and drills like every other. On top of the spend figures it pulls in information from the cost groups themselves:
- Budget and budget year-to-date
- Owners — who’s accountable
- Last updated
If any group has a cost center set, the table rolls up by cost center first, then by group. That gives finance a view that lines up with the accounting system rather than with CloudMonitor’s own hierarchy.
Two markers worth knowing:
- System — the built-in Unallocated group. It can be renamed but never removed, because every charge has to land somewhere.
- The short code beside a name — used by allocation rules to route spend by naming convention.
”Requires repair” on a budget
Section titled “”Requires repair” on a budget”A budget stored in a different currency from your workspace’s reporting currency shows a dash and a Requires repair badge instead of a figure.
CloudMonitor never converts currencies, so it won’t guess. Someone needs to re-enter the amount in the current reporting currency — see the currency note in effective cost vs billed cost.
Getting to one group
Section titled “Getting to one group”Click any row, or use Open cost group in its ⋮ menu, to reach inside a cost group — the full picture for that one group, including its budget, members and history.
If you can manage the group, the same menu offers editing.
What you can see
Section titled “What you can see”Admins see every group. Everyone else sees the groups they belong to. If this report looks emptier than you expect, that’s usually why — see Roles and access.
Filters
Section titled “Filters”Every global filter applies. Note the interaction: filtering to one cost group and then opening this report gives you one row, which is rarely what you want. Clear the cost group filter to compare groups against each other.