Unit Economics
The idea
Section titled “The idea”Total spend is a bad measure of whether cloud cost is under control. A bill that grows 20% while the business grows 40% is a success story that looks like a problem.
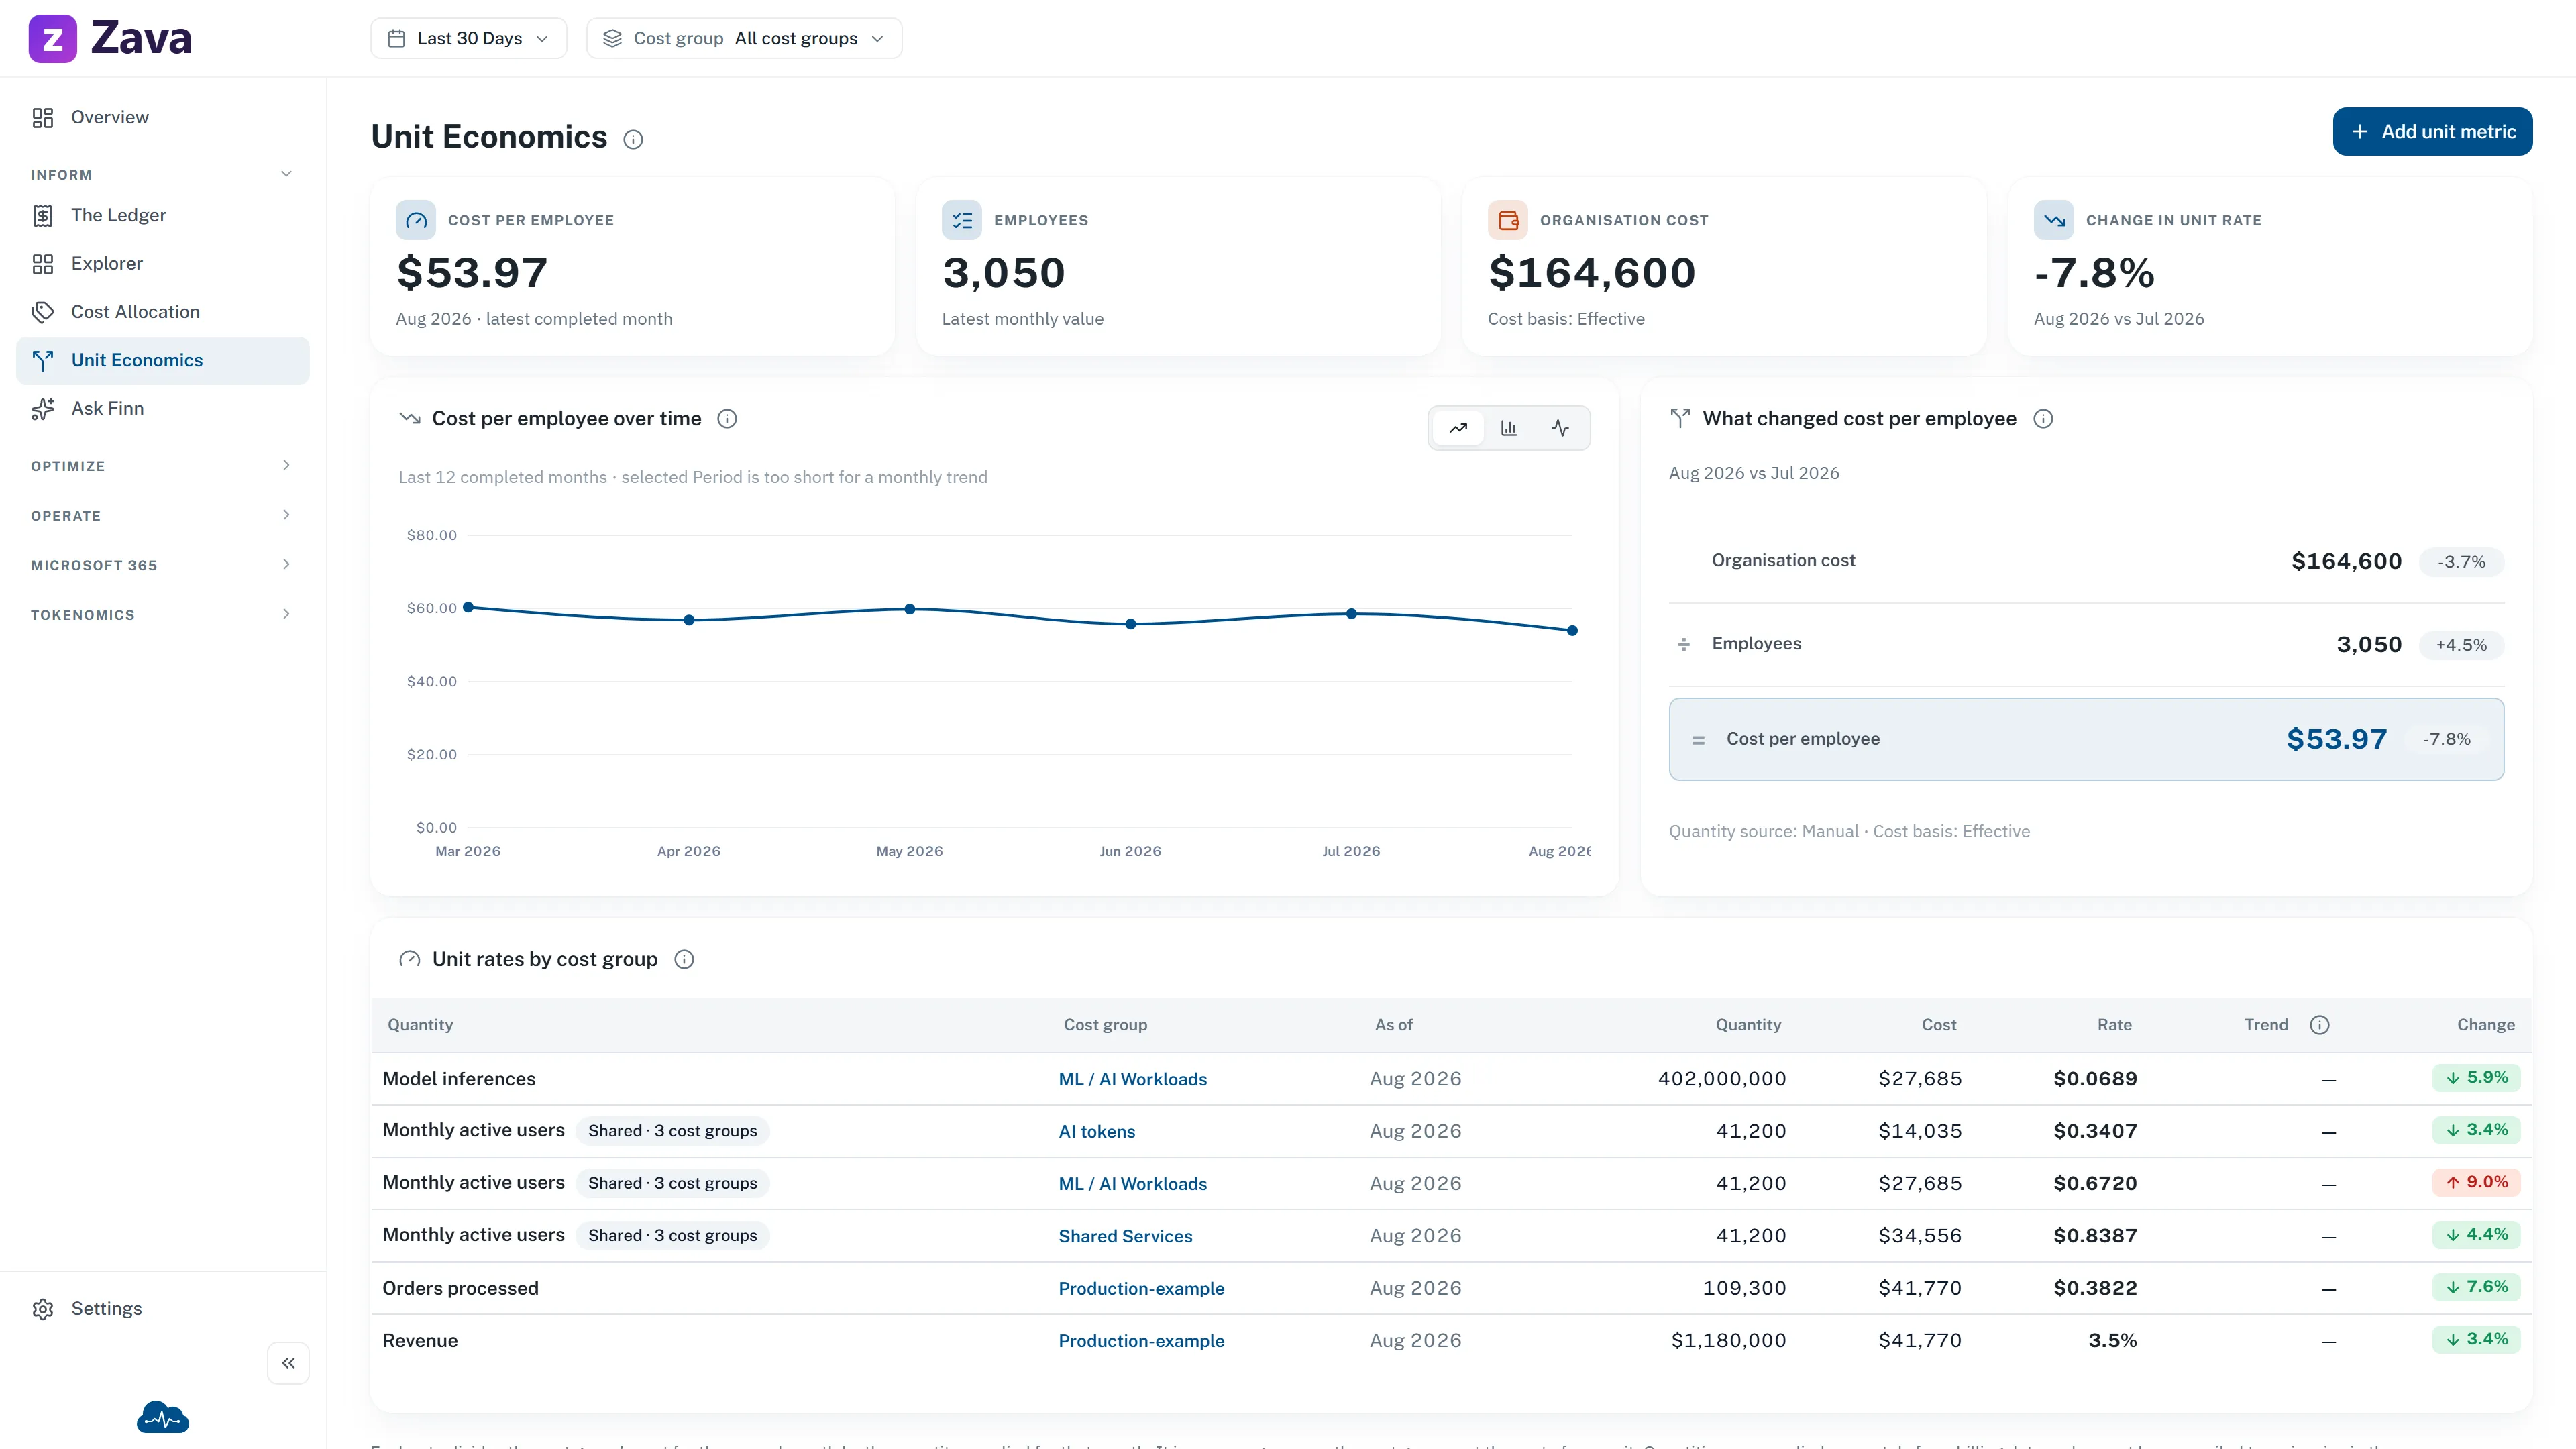
Unit economics fixes that by dividing cost by something the business cares about:
- Cost per customer
- Cost per active user
- Cost per 1k requests
Cost per customer falling while total spend rises is the shape of a healthy, growing business. No other screen in CloudMonitor can show you that.
You supply the denominator
Section titled “You supply the denominator”CloudMonitor knows what you spent. It has no way to know how many orders you shipped, how many patients you saw, or how many customers you have — so you enter one quantity per month for the cost group it describes.
The quantity is whatever your business actually counts. Enter order and the screen reads Cost
per order; enter customer and it reads Cost per customer. A quantity has to grow as you do
more work — a percentage or an uptime figure is not a useful denominator.
Where the numbers are entered
Section titled “Where the numbers are entered”On the cost group, not on the roll-up. Open Cost Allocation ▸ Cost Groups, choose a group, and use its Unit economics tab. Cost group owners enter values; the Unit Economics screen brings the rates together and shows their trend.
What the rate means
Section titled “What the rate means”A rate is the average cost for one completed month divided by that month’s quantity. It is a trend for a team’s efficiency, not a price for the next customer, order, or feature.
CloudMonitor leaves a gap rather than inventing a number: the in-progress month has no rate, and a month with no quantity remains empty. Period and cost basis apply normally; provider and virtual-tag filters do not, because narrowing only the cost side would make the rate misleading.