The Anomaly Inbox
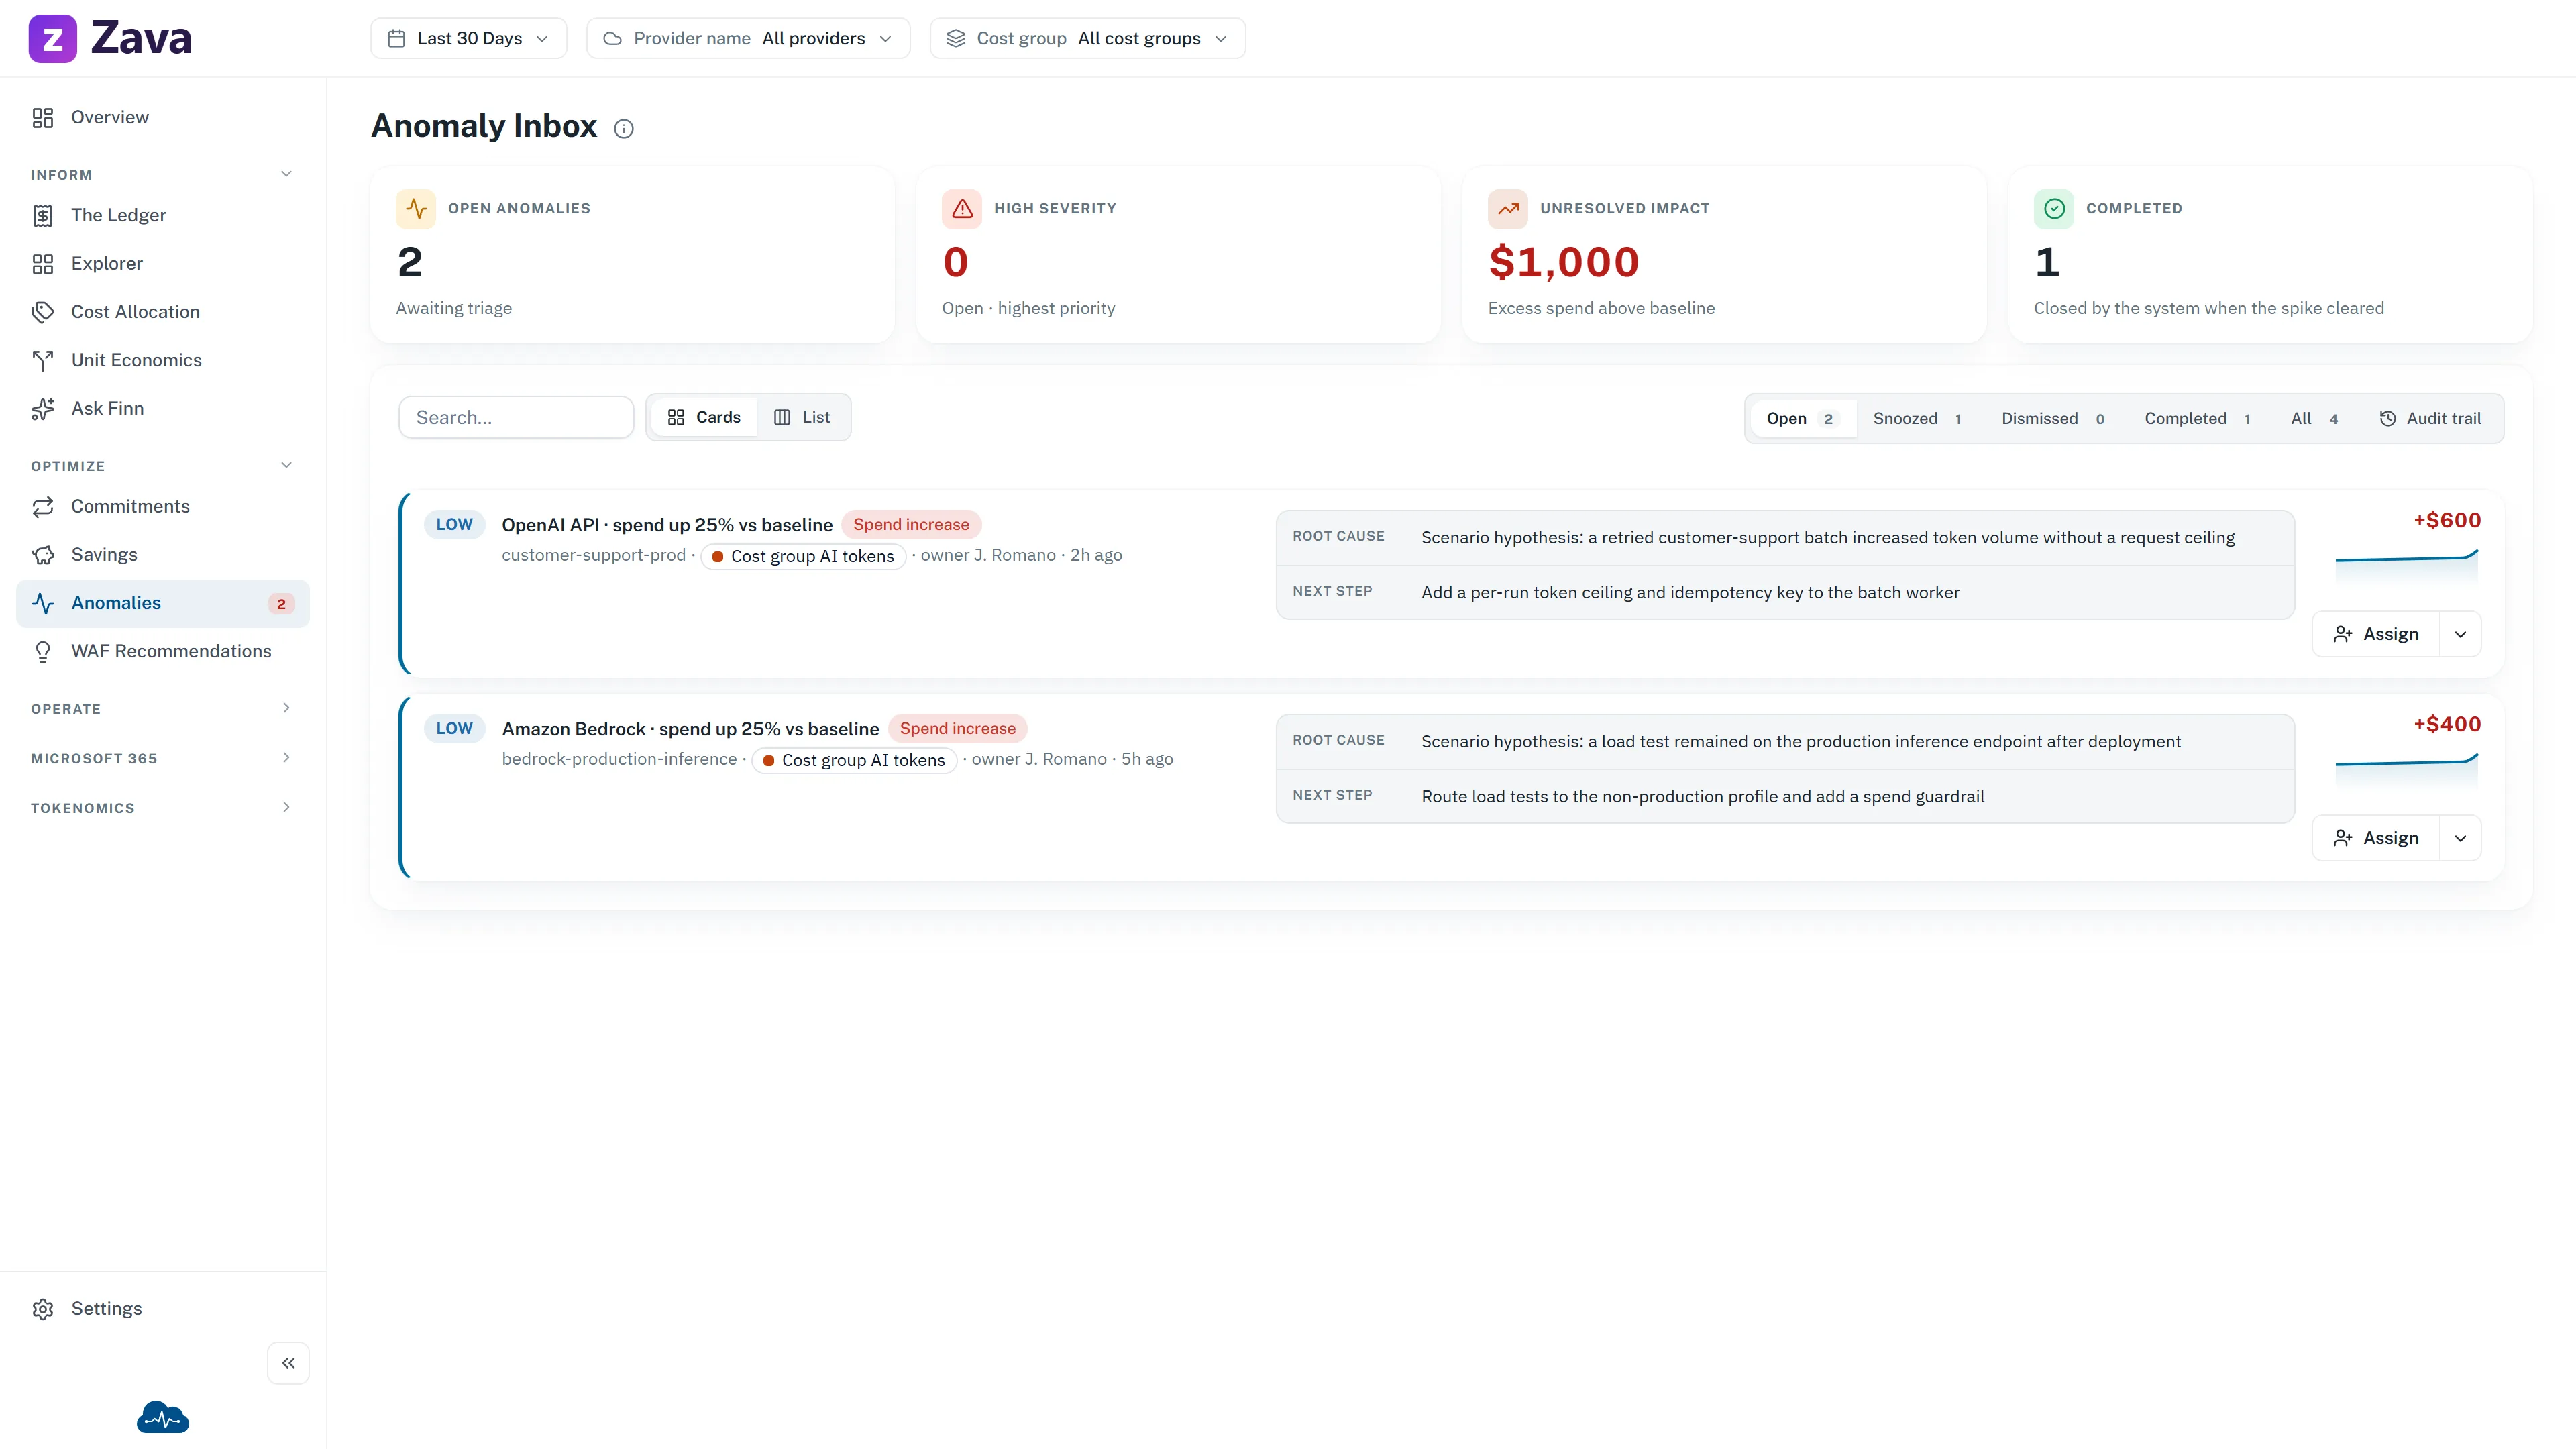
The Anomaly Inbox is where unusual spending shows up. Every entry comes with a named root cause, an accountable owner and a next step — the point being that you can act on it rather than just observe it.
It’s an inbox on purpose. Things arrive, you deal with them, they leave.
The numbers
Section titled “The numbers”Open anomalies — awaiting triage. This is the count on the menu badge.
High severity — the open ones to look at first.
Unresolved impact — Excess spend above baseline. Not the total cost of the affected resource; the amount above what it would normally have cost. That’s the number that represents the actual problem.
Completed — Closed by the system when the spike cleared.
Severity, and what kind of change it was
Section titled “Severity, and what kind of change it was”These are two separate things, and the screen shows both.
Severity comes from how much the daily spend moved: roughly, a doubling or more is high, half again is medium, and below that is low. It’s about size, not direction — a large drop carries the same severity a large rise would.
Change type is a badge beside the headline saying what actually happened:
Spend increase — it cost more than the baseline.
Spend decrease — it cost less. This is the one badge that’s green, and the trend line and amount turn green with it, so a drop reads differently at a glance. Worth knowing rather than celebrating, though: costs falling off a cliff is occasionally good news and quite often a broken pipeline, a deleted resource or an outage.
New spend — nothing was running there the day before. Percentages don’t mean anything against a baseline of zero, so these are rated medium regardless of size and flagged for a look. Something new appearing is usually deliberate, and occasionally isn’t.
Working an anomaly
Section titled “Working an anomaly”Cards or list, whichever you prefer. The list is a sortable table: severity, finding, cost group, owner, root cause, next step, impact, detected, status. It sorts by severity by default.
Next step is a link, not advice. It opens The Ledger filtered to the affected subscription and resource group with the Period set to the day of the spike — the exact slice you’d otherwise spend five minutes assembling.
The ⋮ menu carries the standard triage actions:
- Comment/Send — reassign with a note; opens a pre-filled email containing the item and a link.
- Postpone — a day through to a month.
- Dismiss — with a reason.
- Reopen — for postponed or dismissed items.
- Open in Azure portal.
Anyone in the anomaly’s cost group can triage it. Everyone can open the resource.
Open, Postponed, Dismissed, Completed and All, each with a count. Your tab and view choice persist for the session, so triaging a batch doesn’t keep resetting.
Filters
Section titled “Filters”Cost group and provider apply — anomalies carry the cost group the detection was attributed to, so you can hand a team exactly theirs.
The Period chip is hidden. An anomaly is evaluated over its own window, so the top-bar range never applied, and showing it struck through would just read as a bug.
What counts as an anomaly
Section titled “What counts as an anomaly”An admin sets two thresholds under Settings ▸ Workspace Settings: a minimum cost change and a minimum percentage change. Both must be cleared before anything is raised.
That’s why a large percentage swing on a trivial amount stays quiet, and so does a small percentage move on something enormous. If you’re getting too much noise or suspect you’re missing things, those two numbers are the dial.
An empty inbox is a result
Section titled “An empty inbox is a result”“No active anomalies” means your spend is tracking to baseline. The screen says so in as many words rather than showing a blank panel — it’s genuinely the outcome you want.