Cost by service, team and more
These are The Ledger with the grouping already set. Same rows, same totals, same filters — you’re just spared the setup.
You reach them from the grouping controls on the Ledger, or from a link someone sent you.
| Breakdown | Answers |
|---|---|
| Cost by Cost Group | Which part of the business is this? Rolled up by cost group and business unit, with each group’s share of the total and its change on the previous period |
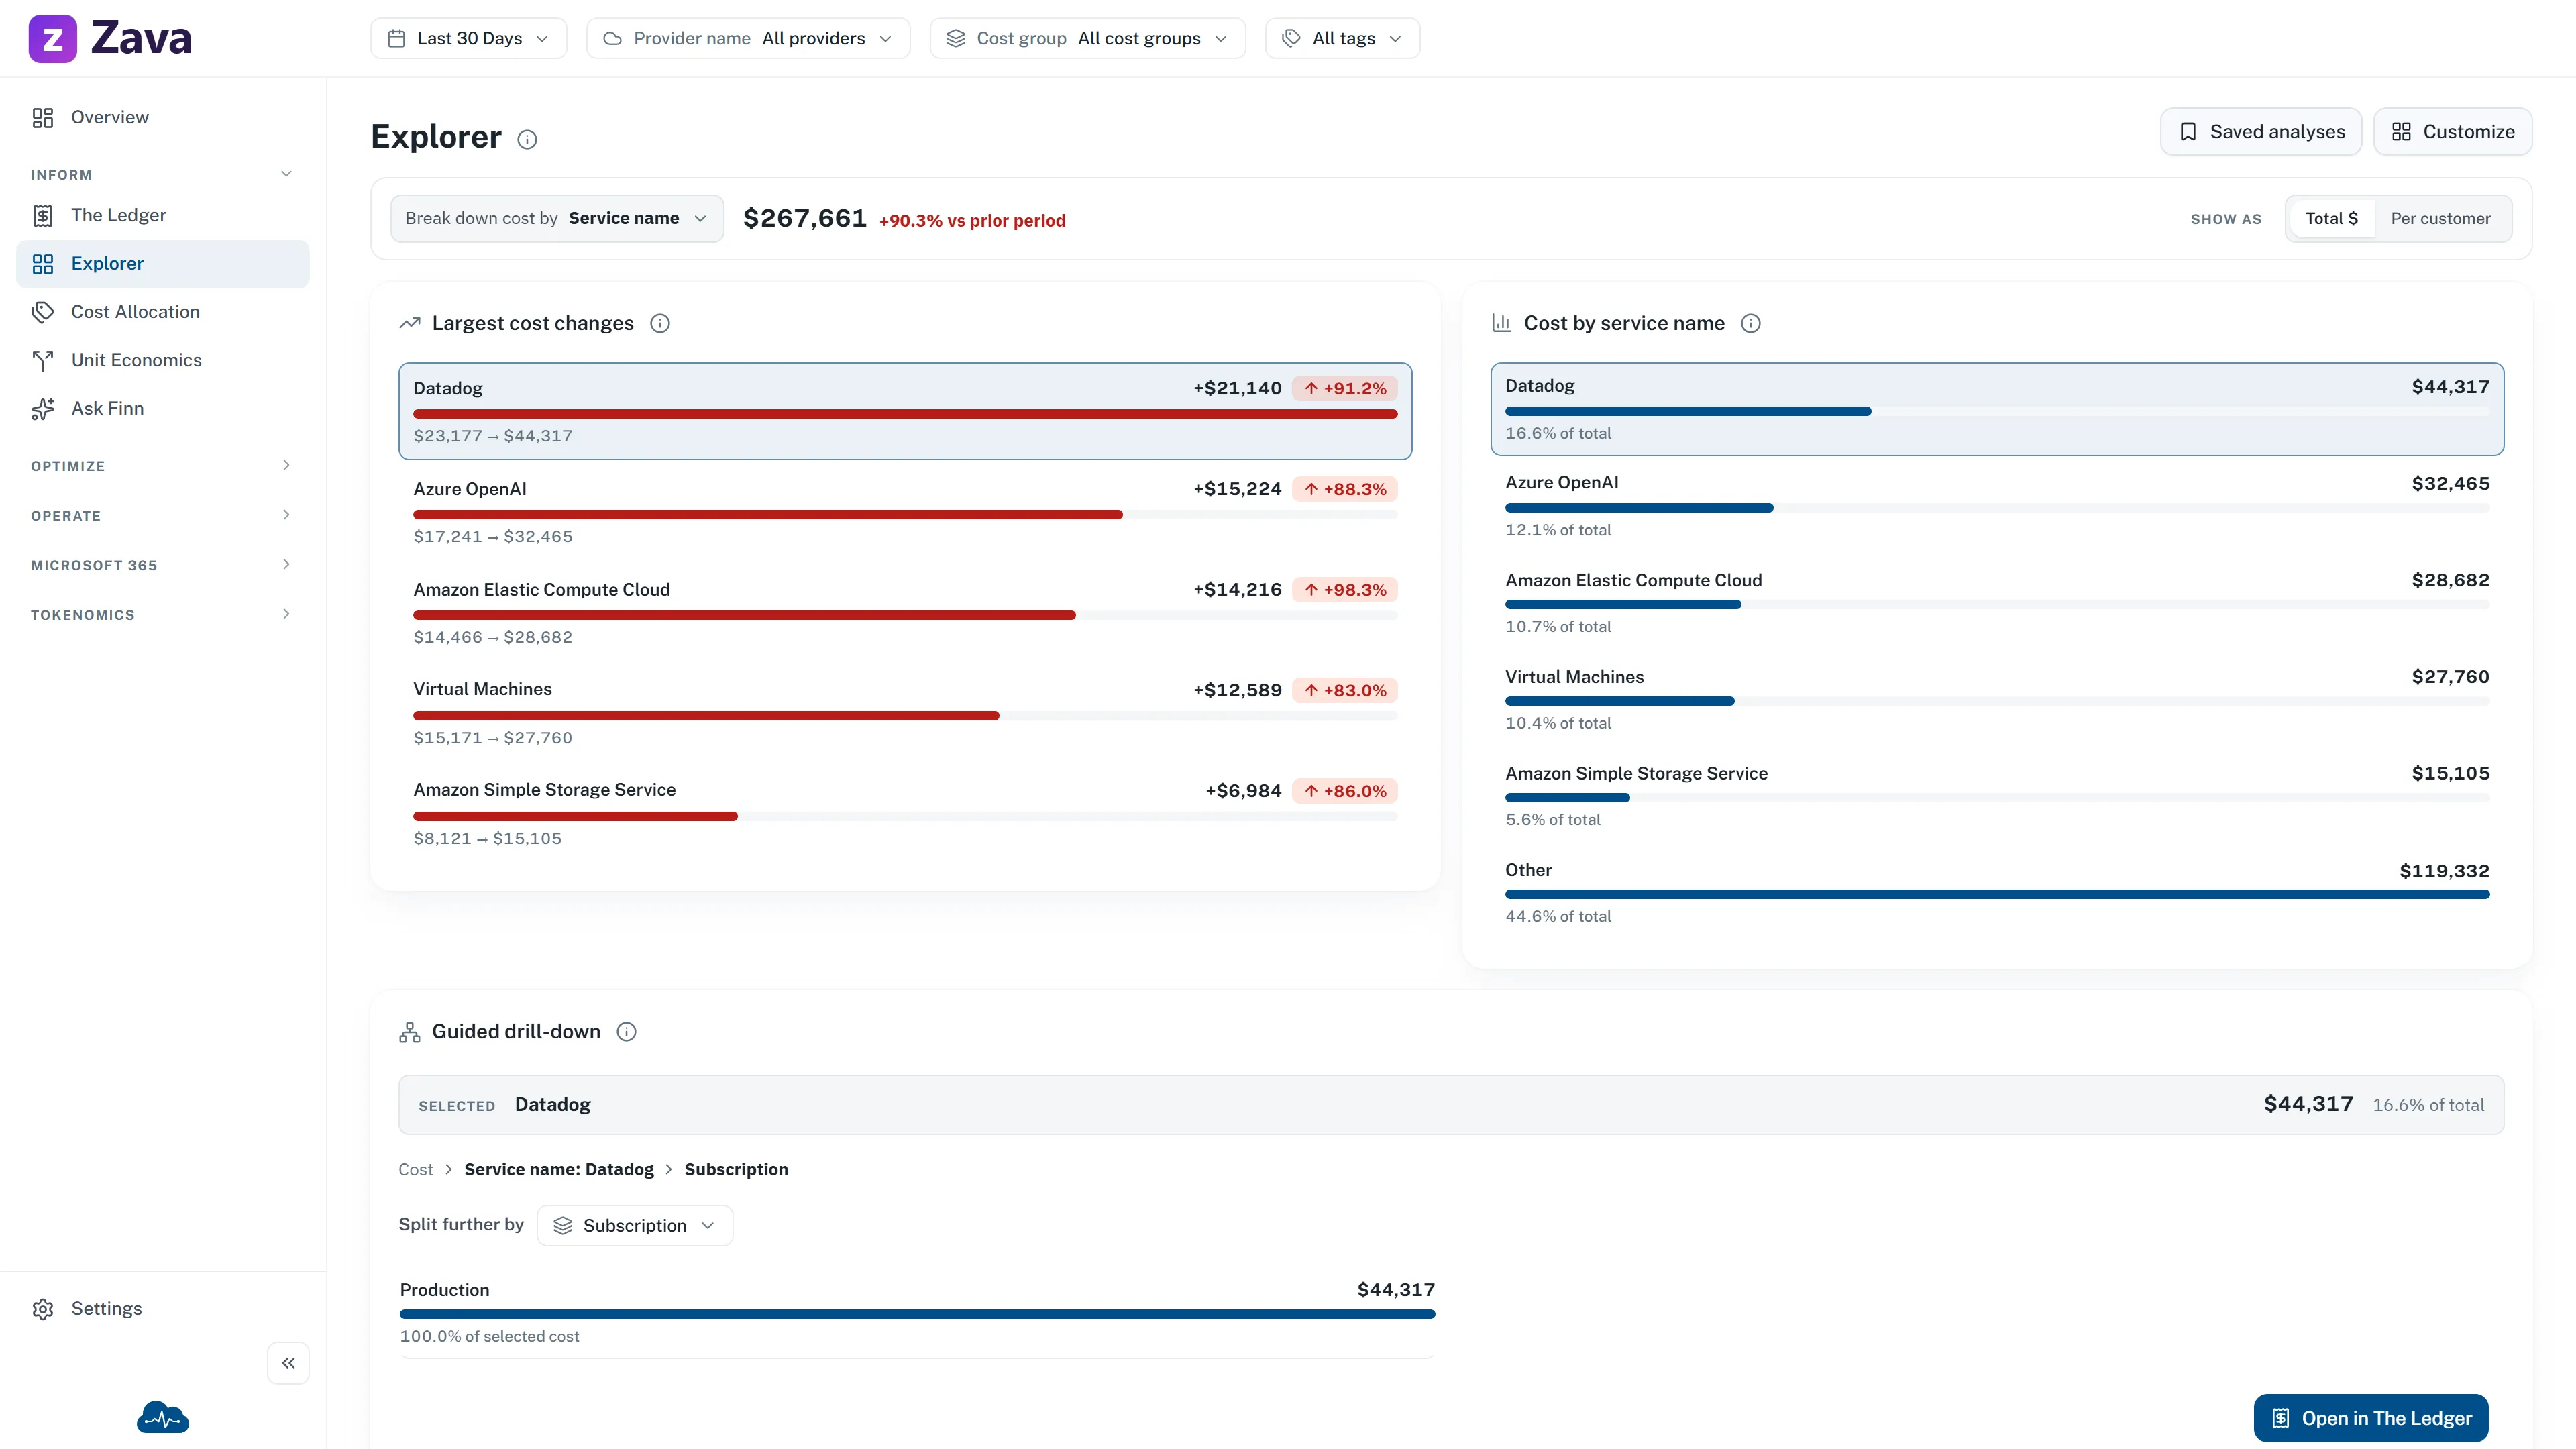
| Cost by Service | What kind of thing are we buying? Virtual machines, storage, networking, databases — then drilled to sub-service |
| Cost by Subscription | Which billing container? Plus the services driving each one |
| Cost by Resource Group | Which project or environment? Top spenders first, the long tail rolled into Others |
| Cost by Tag | However your organization labels things |
Which one to reach for
Section titled “Which one to reach for”Cost by Cost Group for anything with a person’s name on it — budget conversations, chargeback, “whose is this?”. It’s the breakdown that maps to your organization rather than to Azure’s.
Cost by Service when the total moved and you don’t yet know why. Service is usually where a change is most visible: storage creeping up looks nothing like compute creeping up.
Cost by Subscription and Cost by Resource Group when you already suspect where the problem is and want to confirm it.
Cost by Tag is only as good as your tagging. If it looks patchy, that’s a finding in itself — see Unallocated Costs.
They’re a starting point, not a limit
Section titled “They’re a starting point, not a limit”Each one is a saved grouping, not a separate dataset. Change the grouping and you’re back on the Ledger, free to stack up to three levels. Nothing is locked.
For a breakdown none of these offers, The Explorer lets you build your own and save it.
Filters and sharing
Section titled “Filters and sharing”All five honor every global filter and your cost basis. Combine one with the cost group filter and you get a single team’s spend by service, which is usually the exact shape a team lead wants.
Each keeps its own saved views, and the page address follows what you’re looking at — so a link you copy opens on the same breakdown for whoever you send it to.