Limited CloudMonitor Fabric Workload fabric
This page is for people who found CloudMonitor through the Microsoft Fabric Workload Hub. The Fabric workload is a limited, read-only way to discover CloudMonitor inside Microsoft Fabric. It is not the full CloudMonitor product.
For connected billing history, allocation rules, savings analysis, budgets, administration, and Ask Finn, compare the workload with the full CloudMonitor app. Follow the five steps below only when you need to install or use the limited workload experience. Every screenshot is from the CloudMonitor Fabric Workload in light mode; product screens use sample data only.
What you’ll do
Section titled “What you’ll do”- Add the CloudMonitor workload to a Fabric workspace.
- Connect it to the CloudMonitor semantic model prepared during onboarding.
- Start with Overview, then use Inform, Optimize, and Operate to answer specific questions.
- Set your personal preferences.
- Or, explore safely with sample data first.
Before you start
Section titled “Before you start”What you need depends on the arrangement you chose at onboarding.
In your own Fabric tenant (default)
Section titled “In your own Fabric tenant (default)”Your Fabric administrator works through four things, in this order. Configure Fabric access in your own tenant walks through each of them.
- A Microsoft Fabric capacity you own — an F SKU, a Fabric trial, or a Power BI Premium P SKU with Fabric enabled — in a region where Fabric Apps are available. A Power BI Pro license, Premium Per User and Power BI Embedded will not do, because the reports read your data directly from storage.
- A workspace assigned to that capacity. Confirm it in Workspace settings ▸ License info rather than assuming.
- Five tenant settings turned on in the Fabric admin portal. Under Developer settings: Service principals can use Fabric APIs and Service principals can create workspaces, connections, and deployment pipelines. Under Microsoft Fabric: Users can create Fabric items and Enable Fabric App Items (preview). Under OneLake settings: Users can access data stored in OneLake with apps external to Fabric.
- The CloudMonitor application added to that workspace as an Admin. Contributor is not enough, because the deployment creates a Fabric SQL database for the app.
In this arrangement your people sign in with their own accounts, in your own Entra directory.
The CloudMonitor app is a Microsoft Fabric App item, and Fabric Apps are still in preview and not offered in every region. We confirm which regions are available with you at onboarding.
CloudMonitor-hosted
Section titled “CloudMonitor-hosted”Under CloudMonitor-hosted we run the workspace on our own Fabric capacity, so none of those four fall to you. We invite each of your users into our tenant as a B2B guest, and they sign in with the work or school account the invitation was sent to.
In both arrangements you also need the CloudMonitor semantic model in the workspace, because Step 2 below asks for its ID. We create it once your Azure cost data is connected; see Granting CloudMonitor access to your Azure environment.
Architecture and data flow sets out where each layer runs in both arrangements.
Just want to look around? Skip to Step 5 — Try the demo: it runs on sample data with no sign-in.
Step 1 — Add CloudMonitor to your workspace
Section titled “Step 1 — Add CloudMonitor to your workspace”- Open Microsoft Fabric and go to your workspace.
- In the workspace toolbar, click + New item.
- Search for CloudMonitor in the item gallery.
- Click CloudMonitor to add it to your workspace.
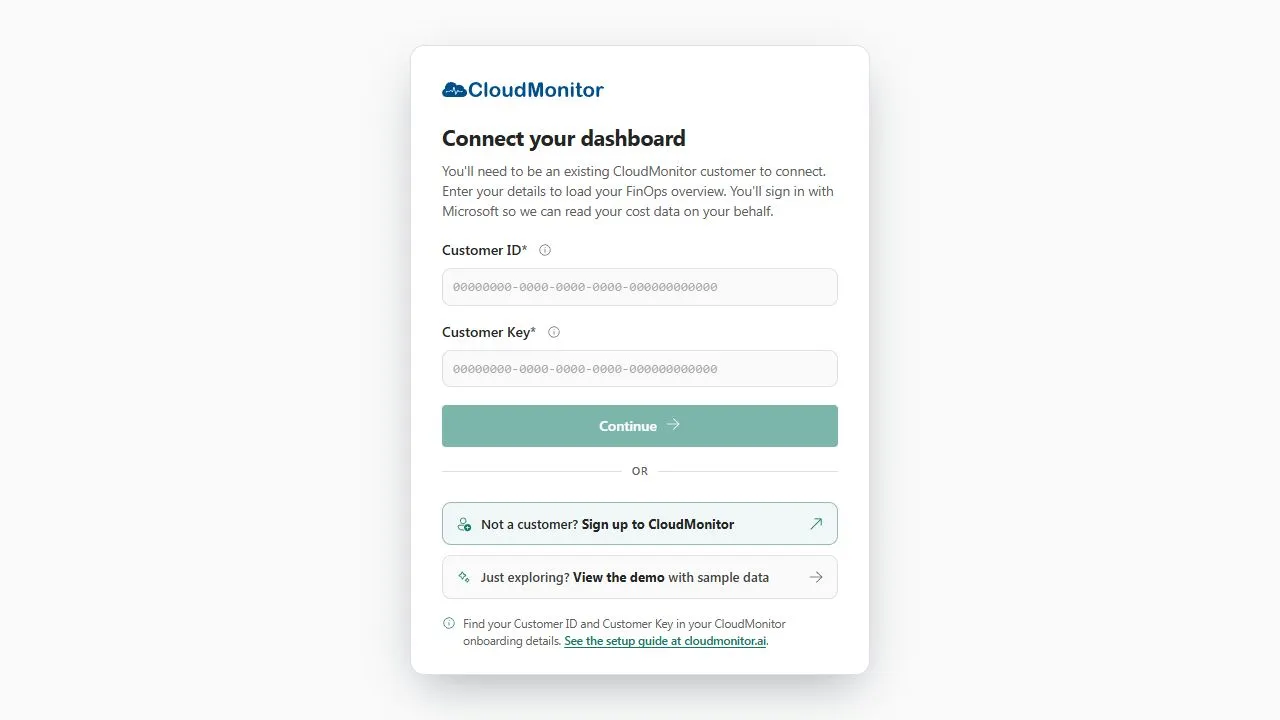
Once added, the CloudMonitor item appears in your workspace. Click it to open the app. Its first screen is the light-mode Fabric Workload connection screen.
Step 2 — Connect your data
Section titled “Step 2 — Connect your data”The first time you open CloudMonitor, you’ll see Connect your dashboard. The screen uses customer-friendly labels; copy these two Fabric IDs from the workspace that holds your CloudMonitor semantic model:
- Customer ID (Fabric Workspace ID) — the ID of the Fabric workspace that contains your CloudMonitor semantic model.
- Customer Key (Semantic Model ID) — the dataset ID of the CloudMonitor semantic model.
Find your Customer ID (Fabric Workspace ID)
Section titled “Find your Customer ID (Fabric Workspace ID)”- In Fabric, open the workspace that contains your semantic model.
- Look at the browser URL — it contains a GUID:
https://app.fabric.microsoft.com/groups/xxxxxxxx-xxxx-xxxx-xxxx-xxxxxxxxxxxx/... - Copy that GUID and paste it into Customer ID.
Find your Customer Key (Semantic Model ID)
Section titled “Find your Customer Key (Semantic Model ID)”- In the same workspace, click your CloudMonitor semantic model to open it.
- Check the URL:
https://app.fabric.microsoft.com/groups/<workspace-id>/modeling/xxxxxxxx-xxxx-xxxx-xxxx-xxxxxxxxxxxx/... - Copy the second GUID and paste it into Customer Key.
Connect and sign in
Section titled “Connect and sign in”Check that the two GUIDs come from the same workspace, then click Continue. A Microsoft sign-in prompt appears. Sign in with your organizational account; CloudMonitor checks that the model is reachable before loading your data.
Step 3 — Explore the app
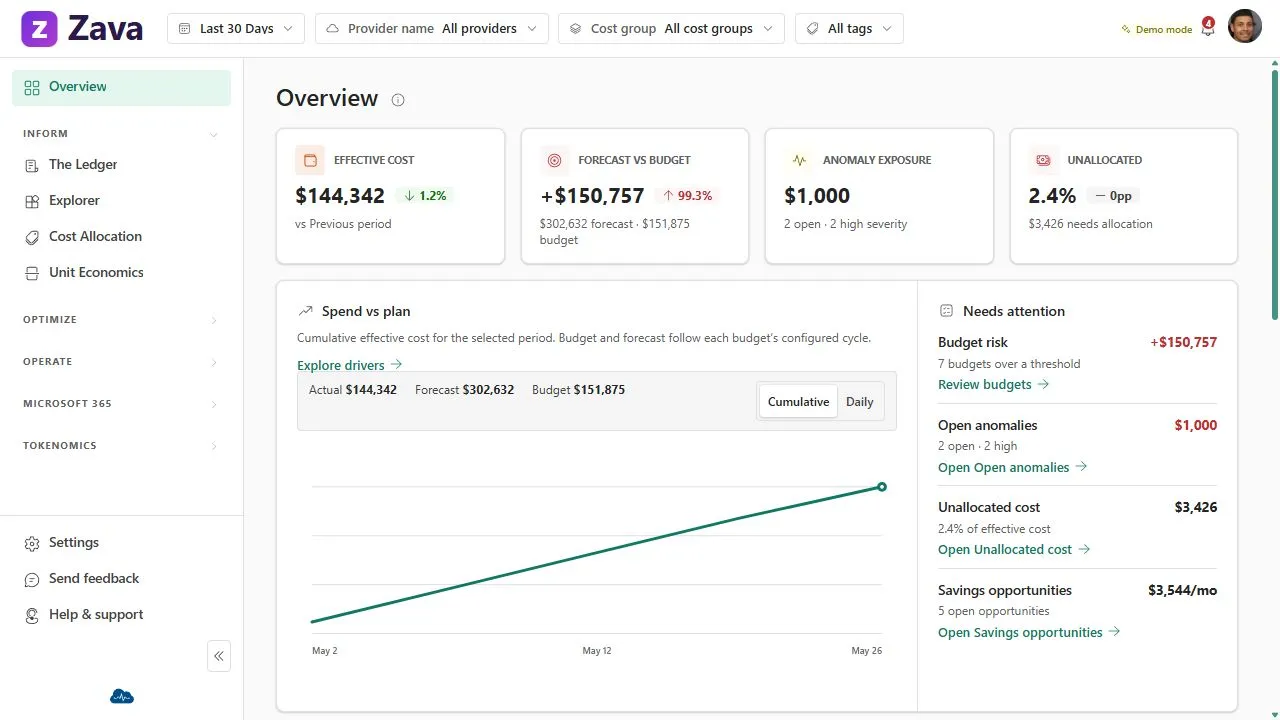
Section titled “Step 3 — Explore the app”After connecting, you land on Overview. Use the left navigation rail to move through the three FinOps phases: Inform, Optimize, and Operate. Start broad, then choose the screen that matches the question you need to answer.
Overview
Section titled “Overview”Your at-a-glance cost summary — total spend, period-over-period trends, cost by group, and any active anomalies. Use the filter bar at the top to slice by provider, cost group, time period, virtual tags, or cost basis (billed vs. effective).
Phase 1 — Inform
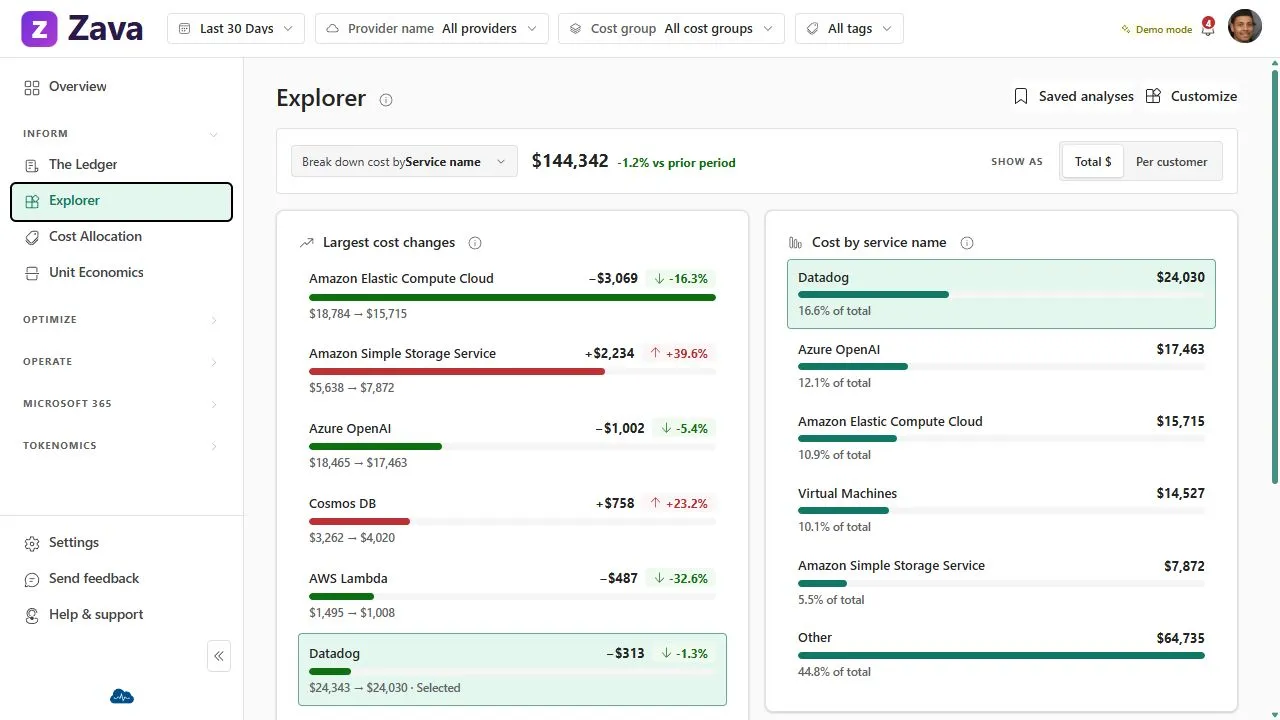
Section titled “Phase 1 — Inform”Understand where your money is going.
| Screen | What it shows |
|---|---|
| The Ledger | Full cost bill — drill into any dimension (service, subscription, region, tag, cost group) |
| Explorer | Cost breakdown across providers and dimensions |
| Unallocated Costs | Spend not yet assigned to a cost group |
| Unit Economics | Cost per unit of business value (requests, users, GB, and so on) |
| AI Spend | Cloud AI service costs (Azure OpenAI and similar) |
| Microsoft 365 | Microsoft 365 licensing, usage, and spend |
| Reports | Saved cost snapshots |
Phase 2 — Optimize
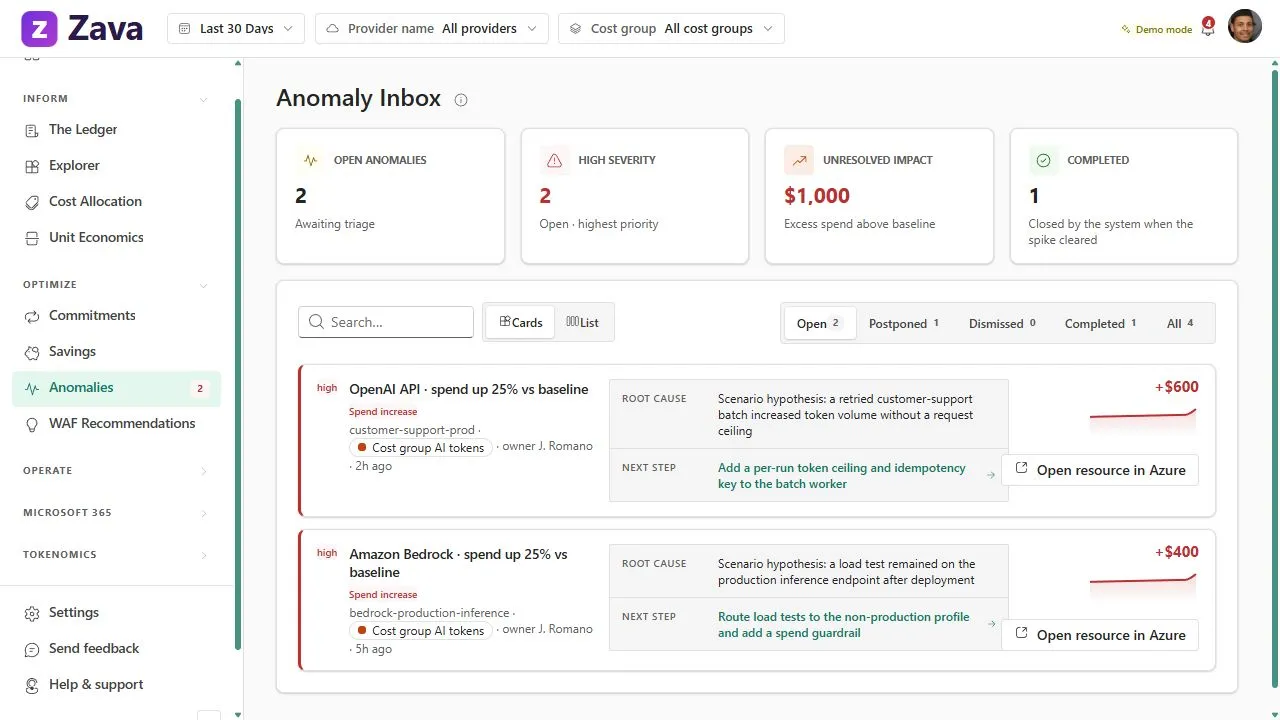
Section titled “Phase 2 — Optimize”Find and act on savings opportunities. The Anomaly Inbox shows the cost changes that need attention, including a suggested next step.
| Screen | What it shows |
|---|---|
| Commitments | Reserved instance and savings plan coverage, utilization, and chargeback |
| Savings | Optimization recommendations ranked by potential savings |
| Anomalies | Cost spikes and dips, with workflow actions (dismiss, postpone, investigate) |
| WAF Recommendations | Well-Architected Framework guidance across five pillars |
Phase 3 — Operate
Section titled “Phase 3 — Operate”Manage your cloud resources and Fabric platform.
| Screen | What it shows |
|---|---|
| Search Resources | Full Azure resource inventory with cost per resource |
| Virtual Machines | VM-level cost and utilization drill-down |
| Fabric | Fabric workspace governance, capacity metrics, and chargeback |
Step 4 — Adjust your profile
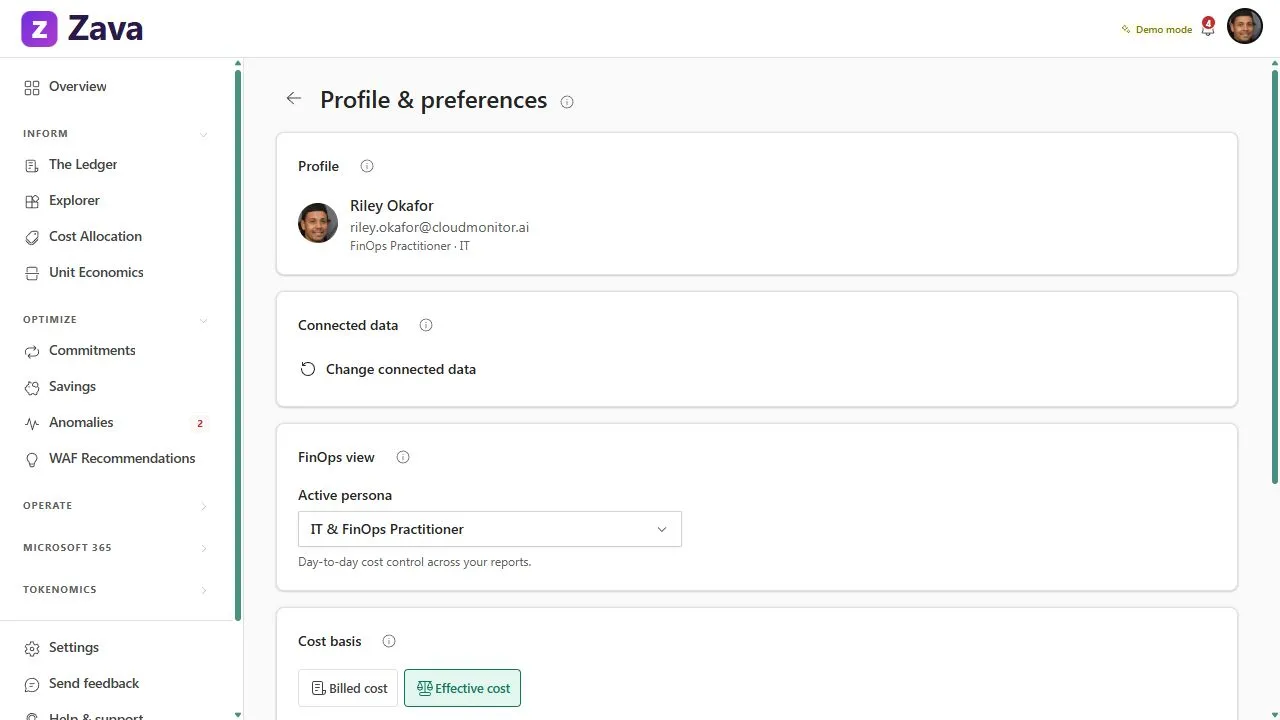
Section titled “Step 4 — Adjust your profile”Select Settings in the navigation rail, then select your name in the upper-right and choose Profile & preferences. There you can:
- Choose your persona — this changes the focus of your landing dashboard.
- Choose a cost basis — billed or effective cost.
- Choose your reporting language and currency.
- Change connected data — returns to the connection screen when you need to use a different semantic model.
The profile screen keeps those personal choices separate from the workspace’s shared data connection.
Step 5 — Try the demo
Section titled “Step 5 — Try the demo”Not ready to connect your own data? On Connect your dashboard, select View the demo. It opens the same navigation and screens with built-in sample data — no IDs and no sign-in required. A Demo mode label reminds you that nothing entered or changed is saved. You can return to the connection screen whenever you are ready to use your own data.
Related
Section titled “Related”- Granting CloudMonitor access to your Azure environment — set up the scoped access that populates your semantic model.
- Architecture and data flow — how CloudMonitor connects to your Azure cost data.
- What data CloudMonitor can see — the exact datasets behind these screens.
- Microsoft Fabric workload attestation — our published vendor attestation (Section III): security, privacy, compliance, and support for the Fabric workload.